Due to its location at subtropical latitudes and proximity to the warm waters of the Gulf of America (formerly Gulf of Mexico) and the Atlantic Ocean, Georgia has a climate characterized by long, hot, humid summers and short, usually mild winters. Georgia is the largest US state in land area east of the Mississippi River and encompasses diverse geographic features. Elevation ranges from sea level along the coast to higher than 4,700 feet in the Blue Ridge Mountains in the northeast. Temperatures vary substantially across the state. Low-elevation inland cities, such as Macon and Columbus, as well as many coastal locations, experience very high summertime temperatures, with typical maximum temperatures exceeding 90°F and often exceeding 95°F (1991–2020 averages). Summer high temperatures in Atlanta are in the high 80s (°F), with few days reaching 95°F or higher. Very hot days in the 90s are rare in the Appalachian Mountains, with average summer highs in the low 80s. In winter, stretches of mild weather often alternate with cold spells. Average low temperatures range from less than 30°F at high elevations to the mid- to low 40s along the coast. Georgia receives abundant precipitation throughout the year, with annual totals ranging from more than 70 inches in the mountainous northeastern corner of the state to less than 45 inches in some central portions (1991–2020 averages). Snowfall is generally light in the state. Even in the northern mountains, total annual snowfall averages less than 5 inches.

Time series of observed and projected temperature change (in degrees Fahrenheit) for Georgia from 1900 to 2100 as described in the caption.
Y-axis values range from negative 4 to positive 16 degrees. Observed annual temperatures from 1900 to 2024 show variability and range from negative 2.1 to positive 2.7 degrees. By the end of the century, projected increases in temperature range from 1.6 to 6.4 degrees under the lower emissions pathway, from 3.4 to 8.6 degrees under the intermediate pathway, and from 7.2 to 13.8 degrees under the higher pathway.
Annual average temperatures in Georgia have increased about 1°F since the beginning of the 20th century, roughly half of the warming for the contiguous United States (Figure 1). During the last century, temperatures in Georgia were high in the early to mid-1920s and mid-1930s, followed by a cooling of almost 2°F by the 1960s. Annual average temperatures have risen since that cool period by about 2.5°F, and most years of the late 2010s and early 2020s exceeded preceding highs. The warmest decade on record was 2015–2024. The contiguous United States as a whole warmed by about 2.2°F since 1900, although it also cooled from the 1930s into the 1960s but not by nearly as much as Georgia. Hypothesized causes for this difference in warming rates in parts of the Southeast US include increased cloud cover and precipitation, increased small particles from coal burning, natural factors related to forest regrowth, decreased heat flux due to irrigation, and multidecadal variability in North Atlantic and tropical Pacific sea surface temperatures.
Extreme high temperatures in Georgia have varied widely over the period of record (1895–2024). The highest number of extremely hot days occurred during the late 1920s, early 1930s, and early 1950s; however, since the late 1950s the number of these days has generally been near or below average (Figure 2a). The number of very warm nights has also shown variability and, with the exception of the 2010–2014 period, has mostly been near or below average since the late 1950s (Figure 2b). Extreme heat is a particular concern for Atlanta and other urban areas. Heat absorbed and emitted by buildings and pavement, as well as other aspects of urban environments, makes cities even warmer than the surrounding countryside, a phenomenon known as the urban heat island effect. A notable heat wave affected Georgia in summer 2012, with Athens setting an all-time record-high temperature of 109°F on June 29 and Atlanta setting its own record of 106°F the following day.
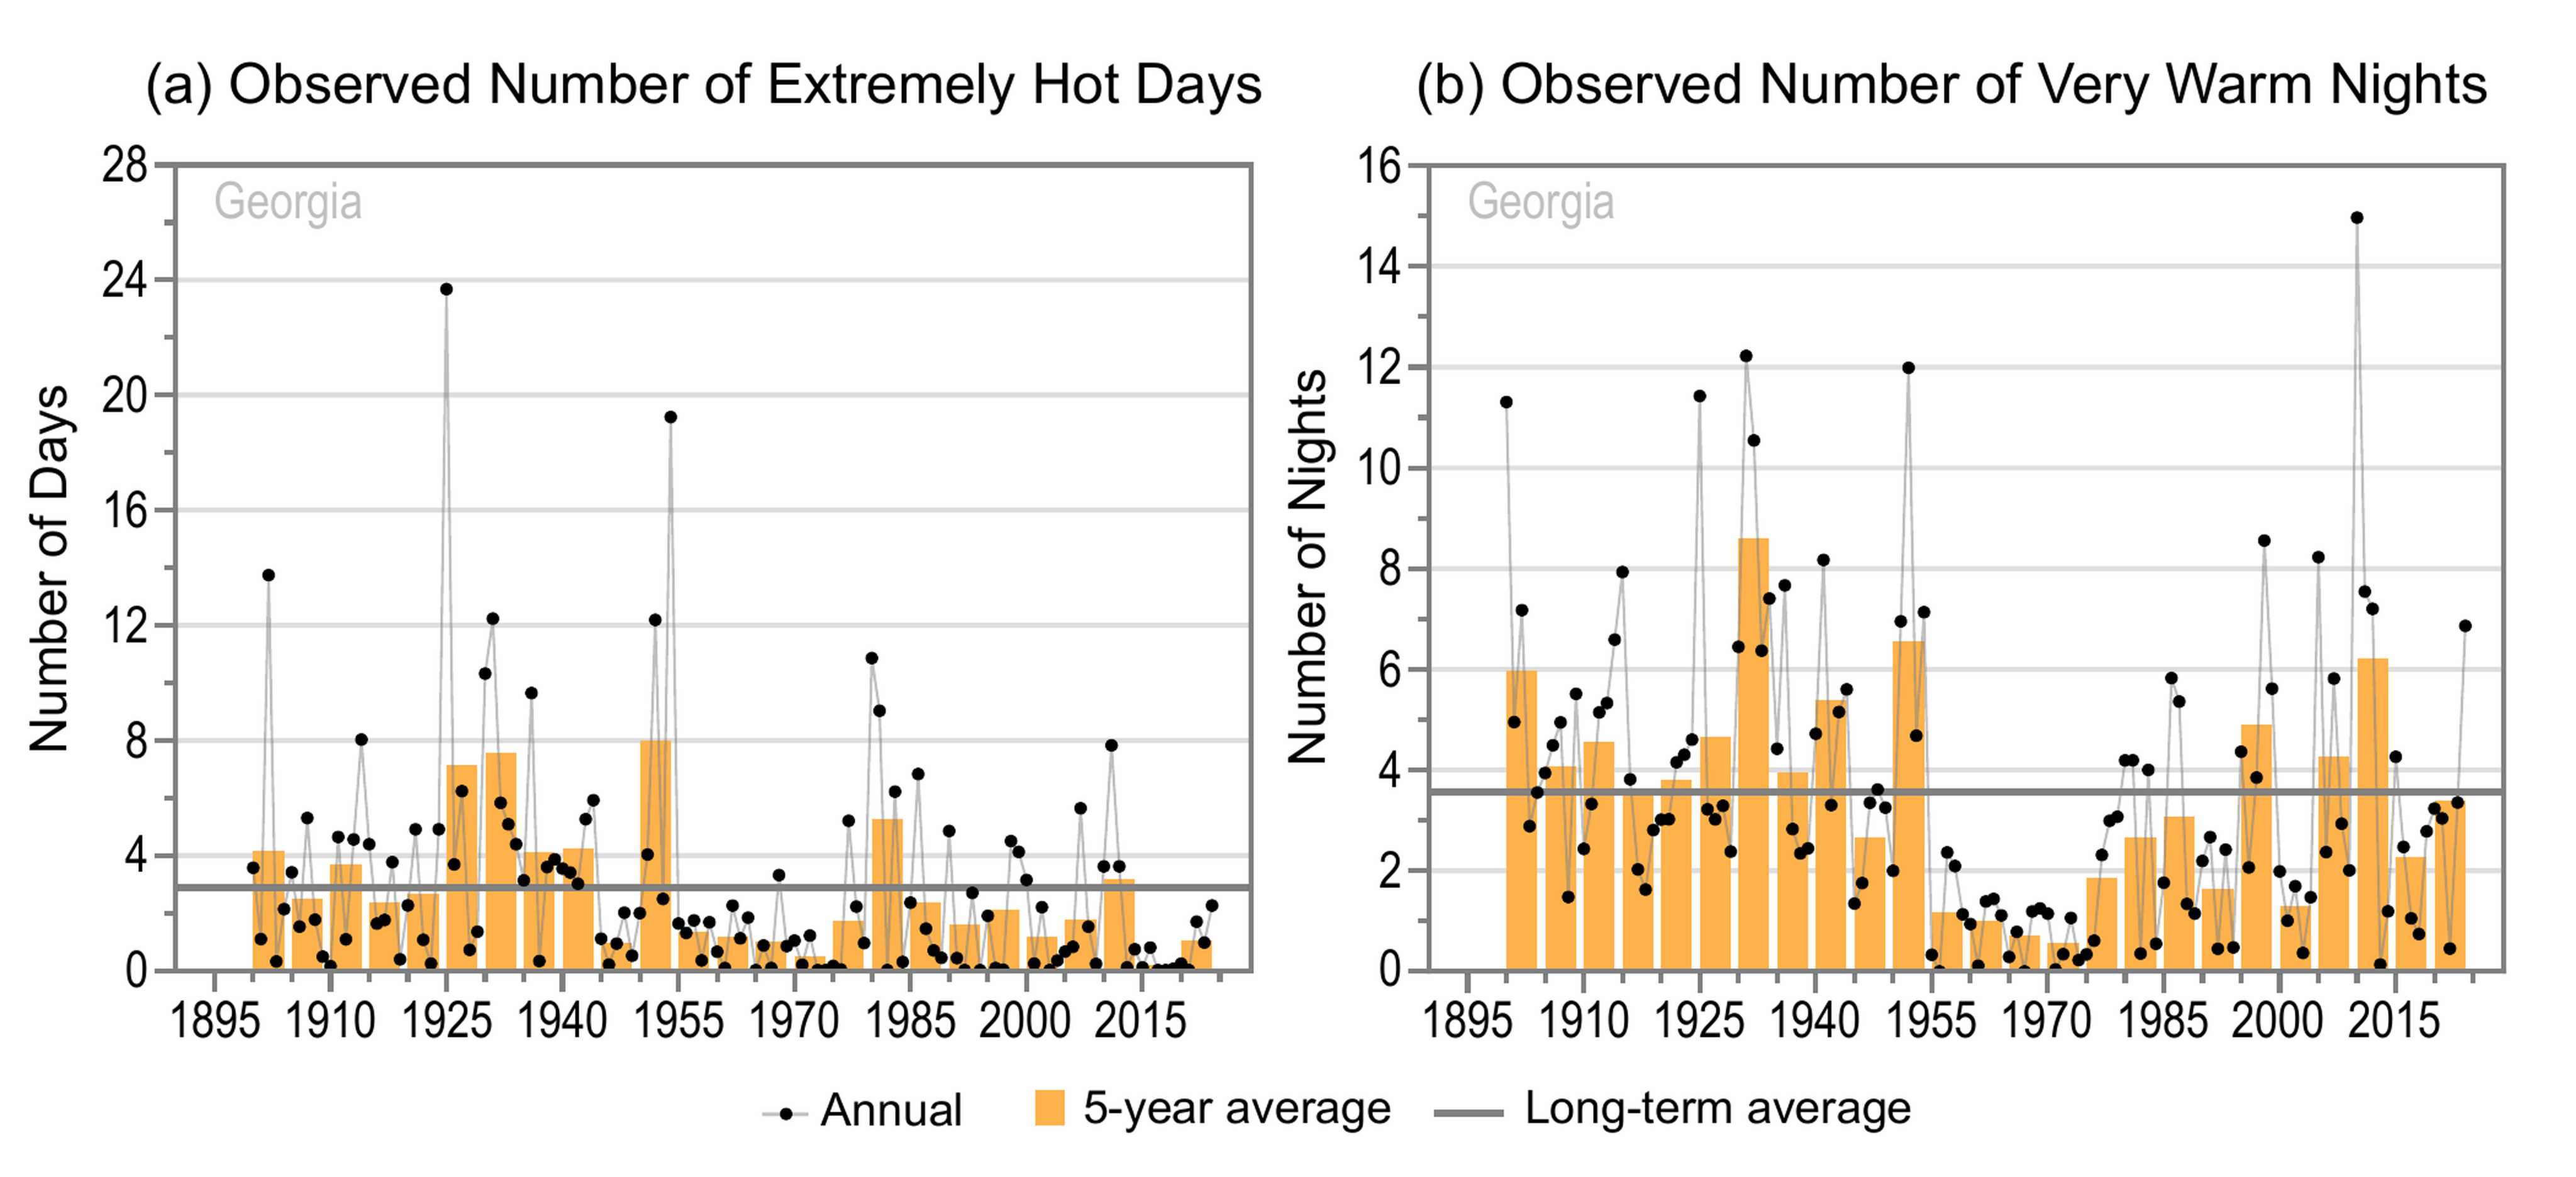
Two graphs of the observed annual number of (a) extremely hot days and (b) very warm nights for Georgia from 1900 to 2024 as described in the caption.
Panel A: Extremely Hot Days
Y-axis values range from 0 to 28 days. Annual values show year-to-year variability and range from 0 to 23.7 days. Five-year values also show variability and are mostly near or above the long-term average of 2.9 days between 1900 and 1954 but are all near or below average since 1955 except for the 1980 to 1984 period. The 2015 to 2019 period has the lowest 5-year value at 0.2 days, and the 1950 to 1954 period has the highest at 8.0 days.
Panel B: Very Warm Nights
Y-axis values range from 0 to 16 nights. Annual values show year-to-year variability and range from 0 to 15.0 nights. Five-year values also show variability and are all near or above the long-term average of 3.6 nights between 1900 and 1954 except for the 1945 to 1949 period, but they are all below average since 1955 except for the 1995 to 1999, 2005 to 2009, and 2010 to 2014 periods. The 1970 to 1974 period has the lowest 5-year value at 0.6 nights, and the 1930 to 1934 period has the highest at 8.6 nights.
The number of freezing days has generally been near or below average since the 1990s (Figure 3). The state's climate is favorable for a wide variety of agricultural crops; however, untimely cold spells can have devastating consequences. After a very warm winter, freezing temperatures from March 14 to 16, 2017, had severe impacts on blueberry and peach crops in particular, with overall industry losses of about $1 billion. In 2023, a warm winter followed by freezing temperatures in March destroyed a significant portion of the state's peach crop, prompting the USDA to declare a natural disaster in 18 Georgia counties.

Graph of the observed annual number of freezing days for Georgia from 1900 to 2024 as described in the caption.
Y-axis values range from 0 to 5 days. Annual values show year-to-year variability and range from 0 to 3.9 days. Five-year values also show variability and are mostly above the long-term average of 0.7 days between 1900 and 1919, mostly near or below average between 1920 and 1969, and all above average between 1970 and 1989. Since 1990, 5-year values are all near or below average except for the 2010 to 2014 period. The 1945 to 1949 period has the lowest 5-year value at 0.2 days, and the 1915 to 1919 period has the highest at 1.5 days.
Statewide total annual precipitation has ranged from a low of 31.1 inches in 1954 to a high of 70.5 inches in 1964 (Figure 4a). Like annual precipitation, summer precipitation shows no long-term trend (Figure 4b). The number of 3-inch extreme precipitation events also shows no long-term trend; however, the 2020–2024 period had the highest 5-year average on record (Figure 5).

Two graphs of the observed total (a) annual and (b) summer precipitation for Georgia from 1895 to 2024 as described in the caption.
Panel A: Total Annual Precipitation
Y-axis values range from 28 to 76 inches. Annual values show year-to-year variability and range from 31.1 to 70.5 inches. Five-year values also show variability and are mostly near or below the long-term average of 50.1 inches across the entire period, showing no clear trend. Exceptions include the 1945 to 1949, 1960 to 1964, and 2020 to 2024 periods, which have the highest 5-year values at 55.4, 54.2, and 54.4 inches, respectively. The 1950 to 1954 period has the lowest 5-year value at 44.9 inches.
Panel B: Total Summer Precipitation
Y-axis values range from 4 to 28 inches. Annual values show year-to-year variability and range from 8.6 to 24.8 inches. Five-year values also show variability and are mostly near or above the long-term average of 15.1 inches between 1895 and 1974 but are all near or below average since 1975 except for the 1990 to 1994 and 2020 to 2024 periods. The 1980 to 1984 period has the lowest 5-year value at 12.4 inches, and the 1915 to 1919 period has the highest at 16.7 inches.

Graph of the observed annual number of 3-inch extreme precipitation events for Georgia from 1900 to 2024 as described in the caption.
Y-axis values range from 0.0 to 3.5 events. Annual values show year-to-year variability and range from 0.1 to 3.0 events. Five-year values also show variability and are above the long-term average of 0.9 events between 1900 and 1909, mostly near or below average between 1910 and 1989, and mostly near or above average since 1990. The 1985 to 1989 period has the lowest 5-year value at 0.6 events, and the 2020 to 2024 period has the highest at 1.8 events.
Georgia's summers are typically hot and humid, with frequent afternoon and evening thunderstorms, However, when weather patterns limit rainfall, the state can experience extreme heat and drought. In 2006 and 2007, back-to-back dry years produced one of Georgia's worst droughts on record. The state also experienced severe drought (as defined by the US Drought monitor) in 2010–2012, as well as flash droughts (the rapid onset or intensification of drought) in 2016–2017 and 2019. These droughts had serious impacts on agriculture and water supplies and increased wildfire risk.
Thunderstorms sometimes bring tornadoes, heavy rains, and flooding. During September 16–22, 2009, torrential rains—with 7-day totals of more than 15 inches in some areas—caused severe flooding in northern Georgia and the Atlanta area. On March 14, 2008, a tornado struck downtown Atlanta, causing one death and more than $150 million in damages. The following day, the same storm system spawned multiple tornadoes across the state, including an EF3 tornado in northwestern Georgia, which killed two people. An EF4 tornado hit Catoosa County on the evening of April 27, 2011, as part of the historic 2011 Super Outbreak. A more recent EF4 tornado occurred on April 4, 2022, in Bryan County, causing one fatality and widespread damage to homes, structures, and trees.
Although Georgia rarely experiences direct landfall of hurricanes, the remnants of tropical storm systems can bring heavy rains and strong winds to the state. In 1994, Tropical Storm Alberto passed over the state, resulting in significant rain totals. More than 27 inches of precipitation fell in Americus in the southwestern part of the state—21 of those inches fell within 24 hours, setting a new state record. Alberto caused significant flooding, particularly along the Flint and Ocmulgee Rivers, that resulted in 33 deaths and extensive agricultural losses. In September 2004, precipitation from the remnants of three hurricanes—Frances, Ivan, and Jeanne—resulted in Georgia's wettest September on record and significant flooding across the state. In 2018, Hurricane Michael became the first major hurricane (Category 3+) to directly impact Georgia since the 1890s, leading to widespread tree damage, power outages, and severe crop damage. On September 27, 2024, Hurricane Helene brought wind gusts of over 90 mph, 3 tornadoes, and 10–15 inches of rain. The storm knocked out power to 1.3 million people and caused more than two dozen deaths, most from falling trees. The number of landfalling Atlantic hurricanes is not expected to rise. However, rainfall rates from such storms, as well as the proportion of time they spend as major hurricanes, are projected to increase.
Under the intermediate and higher emissions pathways, historically unprecedented warming is projected during this century (Figure 1). Even under the lower emissions pathway, most projections show annual average temperatures exceeding historical levels by the middle of the century. However, projections for all three pathways show a large range of potential temperature increases, and some projections for the lower pathway are comparable to recent observed values. Heat waves are projected to intensify in Georgia, which already experiences hot and humid conditions, whereas the intensity of cold waves is expected to decrease.
Under the intermediate emissions pathway, projections indicate increases in total annual precipitation by midcentury for Georgia; however, the projected changes are not statistically significant (Figure 6). There is similar uncertainty in projections for seasonal precipitation, although models generally indicate statewide increases in all seasons. The frequency and intensity of extreme precipitation events are projected to increase, potentially increasing the frequency and intensity of floods.

Map of the contiguous United States showing the projected changes in total annual precipitation by the middle of this century as described in the caption. The state of Georgia is outlined in black.
Legend values range from less than negative 10 to greater than positive 15 percent. Note: unless otherwise specified, projected values are not statistically significant.
Georgia
The majority of Georgia is projected to see increases in total annual precipitation of up to 5 percent, with the northeastern part of the state expected to see increases of 5 to 10 percent.
Contiguous US
Projected increases in total annual precipitation are as follows: up to 5 percent for most of the Southeast, as well as the central Midwest, central Great Plains, central West, and Northwest; and 5 to 10 percent for all of the Northeast, as well as portions of the Mid-Atlantic, Southeast, northern Midwest, northern Great Plains, and Pacific Northwest, with statistically significant increases in the 5 to 10 percent range for the Northeast, northeastern Midwest, and portions of the northern Great Plains and Pacific Northwest.
Projected decreases of up to 5 percent are expected across most of Texas, New Mexico, and Arizona, as well as southern California.
Higher temperatures are expected to increase evaporation rates and decrease soil moisture during dry spells, leading to greater drought intensity. This could potentially increase competition for water resources, such as the Apalachicola–Chattahoochee–Flint River Basin, which currently supports large population centers in multiple states.
Georgia is at extreme risk for sea level rise due to its low coastal elevation. On average, the state experienced about 8 inches of sea level rise between 1970 and 2020—compared to 6 inches for the contiguous US as a whole—and projections under the Intermediate sea level scenario show additional increases of about 11 inches by 2050 and 1.7 feet by 2070 (Figure 7). Across the five scenarios shown in Figure 7, the projected increases from 2020 to 2070 range from about 1 to 3.5 feet. Continued sea level rise poses major challenges to Georgia's existing coastal water management system, threatening economic harm through damage to ecosystems, property, infrastructure, and the tourism and agriculture industries.

Two time series of observed and projected relative sea level change for (a) the contiguous US and (b) Georgia from 1970 to 2070 as described in the caption.
Y-axis values range from negative 1 to positive 4 feet for both graphs. Legends in both graphs denote sources of historical data and scenarios for projections. Line colors for historical data are black for tide gauge data and orange for satellite data. Line and shading colors for projections based on five scenarios are as follows: light blue, Low; medium blue, Intermediate-Low; dark blue, Intermediate; yellow, Intermediate-High; and dark orange, High.
Panel A: Contiguous US
Tide gauge and satellite data generally show increases but with year-to-year variability. Projected data show increases under all scenarios. Tide gauge values range from a minimum of negative 0.3 feet in 1976 to a maximum of positive 0.4 feet in 2023. Satellite values range from a minimum of 0.0 feet in 1994 to a maximum of 0.4 feet in 2023. Projected sea level median values (lines) for the Low scenario range from 0.3 feet in 2020 to 1.1 feet in 2070, compared to 0.4 feet in 2020 to 3.1 feet in 2070 for the High scenario. Likely ranges (shading) become wider over the period shown. The ranges of likely values in 2070 for each of the five scenarios are as follows: Low scenario, from 0.9 to 1.4 feet; Intermediate-Low, 1.2 to 1.7 feet; Intermediate, 1.5 to 2.2 feet; Intermediate-High, 1.8 to 3.1 feet; and High, 2.4 to 3.8 feet.
Panel B: Georgia
All historical and future scenario lines show increases higher than those in the contiguous US graph. Tide gauge values range from a minimum of negative 0.4 feet in 1976 to a maximum of positive 0.7 feet in 2023. Satellite values range from a minimum of negative 0.1 feet in 1998 to a maximum of positive 0.5 feet in 2023. Projected sea level median values (lines) for the Low scenario range from 0.4 feet in 2020 to 1.3 feet in 2070, compared to 0.4 feet in 2020 to 3.4 feet in 2070 for the High scenario. Likely ranges (shading) become wider over the period shown. The ranges of likely values in 2070 for each of the five scenarios are as follows: Low scenario, from 1.1 to 1.6 feet; Intermediate-Low, 1.4 to 1.9 feet; Intermediate, 1.7 to 2.4 feet; Intermediate-High, 2.1 to 3.3 feet; and High, 2.6 to 4.0 feet.
Sea level rise has caused an increase in high-tide floods associated with nuisance-level impacts, which are occurring more frequently, even on sunny days. High-tide flooding occurs when one or more factors—sea level rise, winds, changes in ocean currents, full or new moons—push water levels above the normal high-tide mark. These events can damage infrastructure, cause road closures, and overwhelm storm drains. High-tide flooding has increased in all US coastal areas, with more rapid increases along the East and Gulf Coasts, and is likely to occur more frequently in Georgia as global and local sea levels continue to rise. The number of high-tide flood days has increased at Fort Pulaski, at the mouth of the Savannah River, with the greatest number occurring in 2023. Under both the Intermediate-Low and Intermediate scenarios, high-tide floods are projected to occur much more frequently in future years (Figure 8).
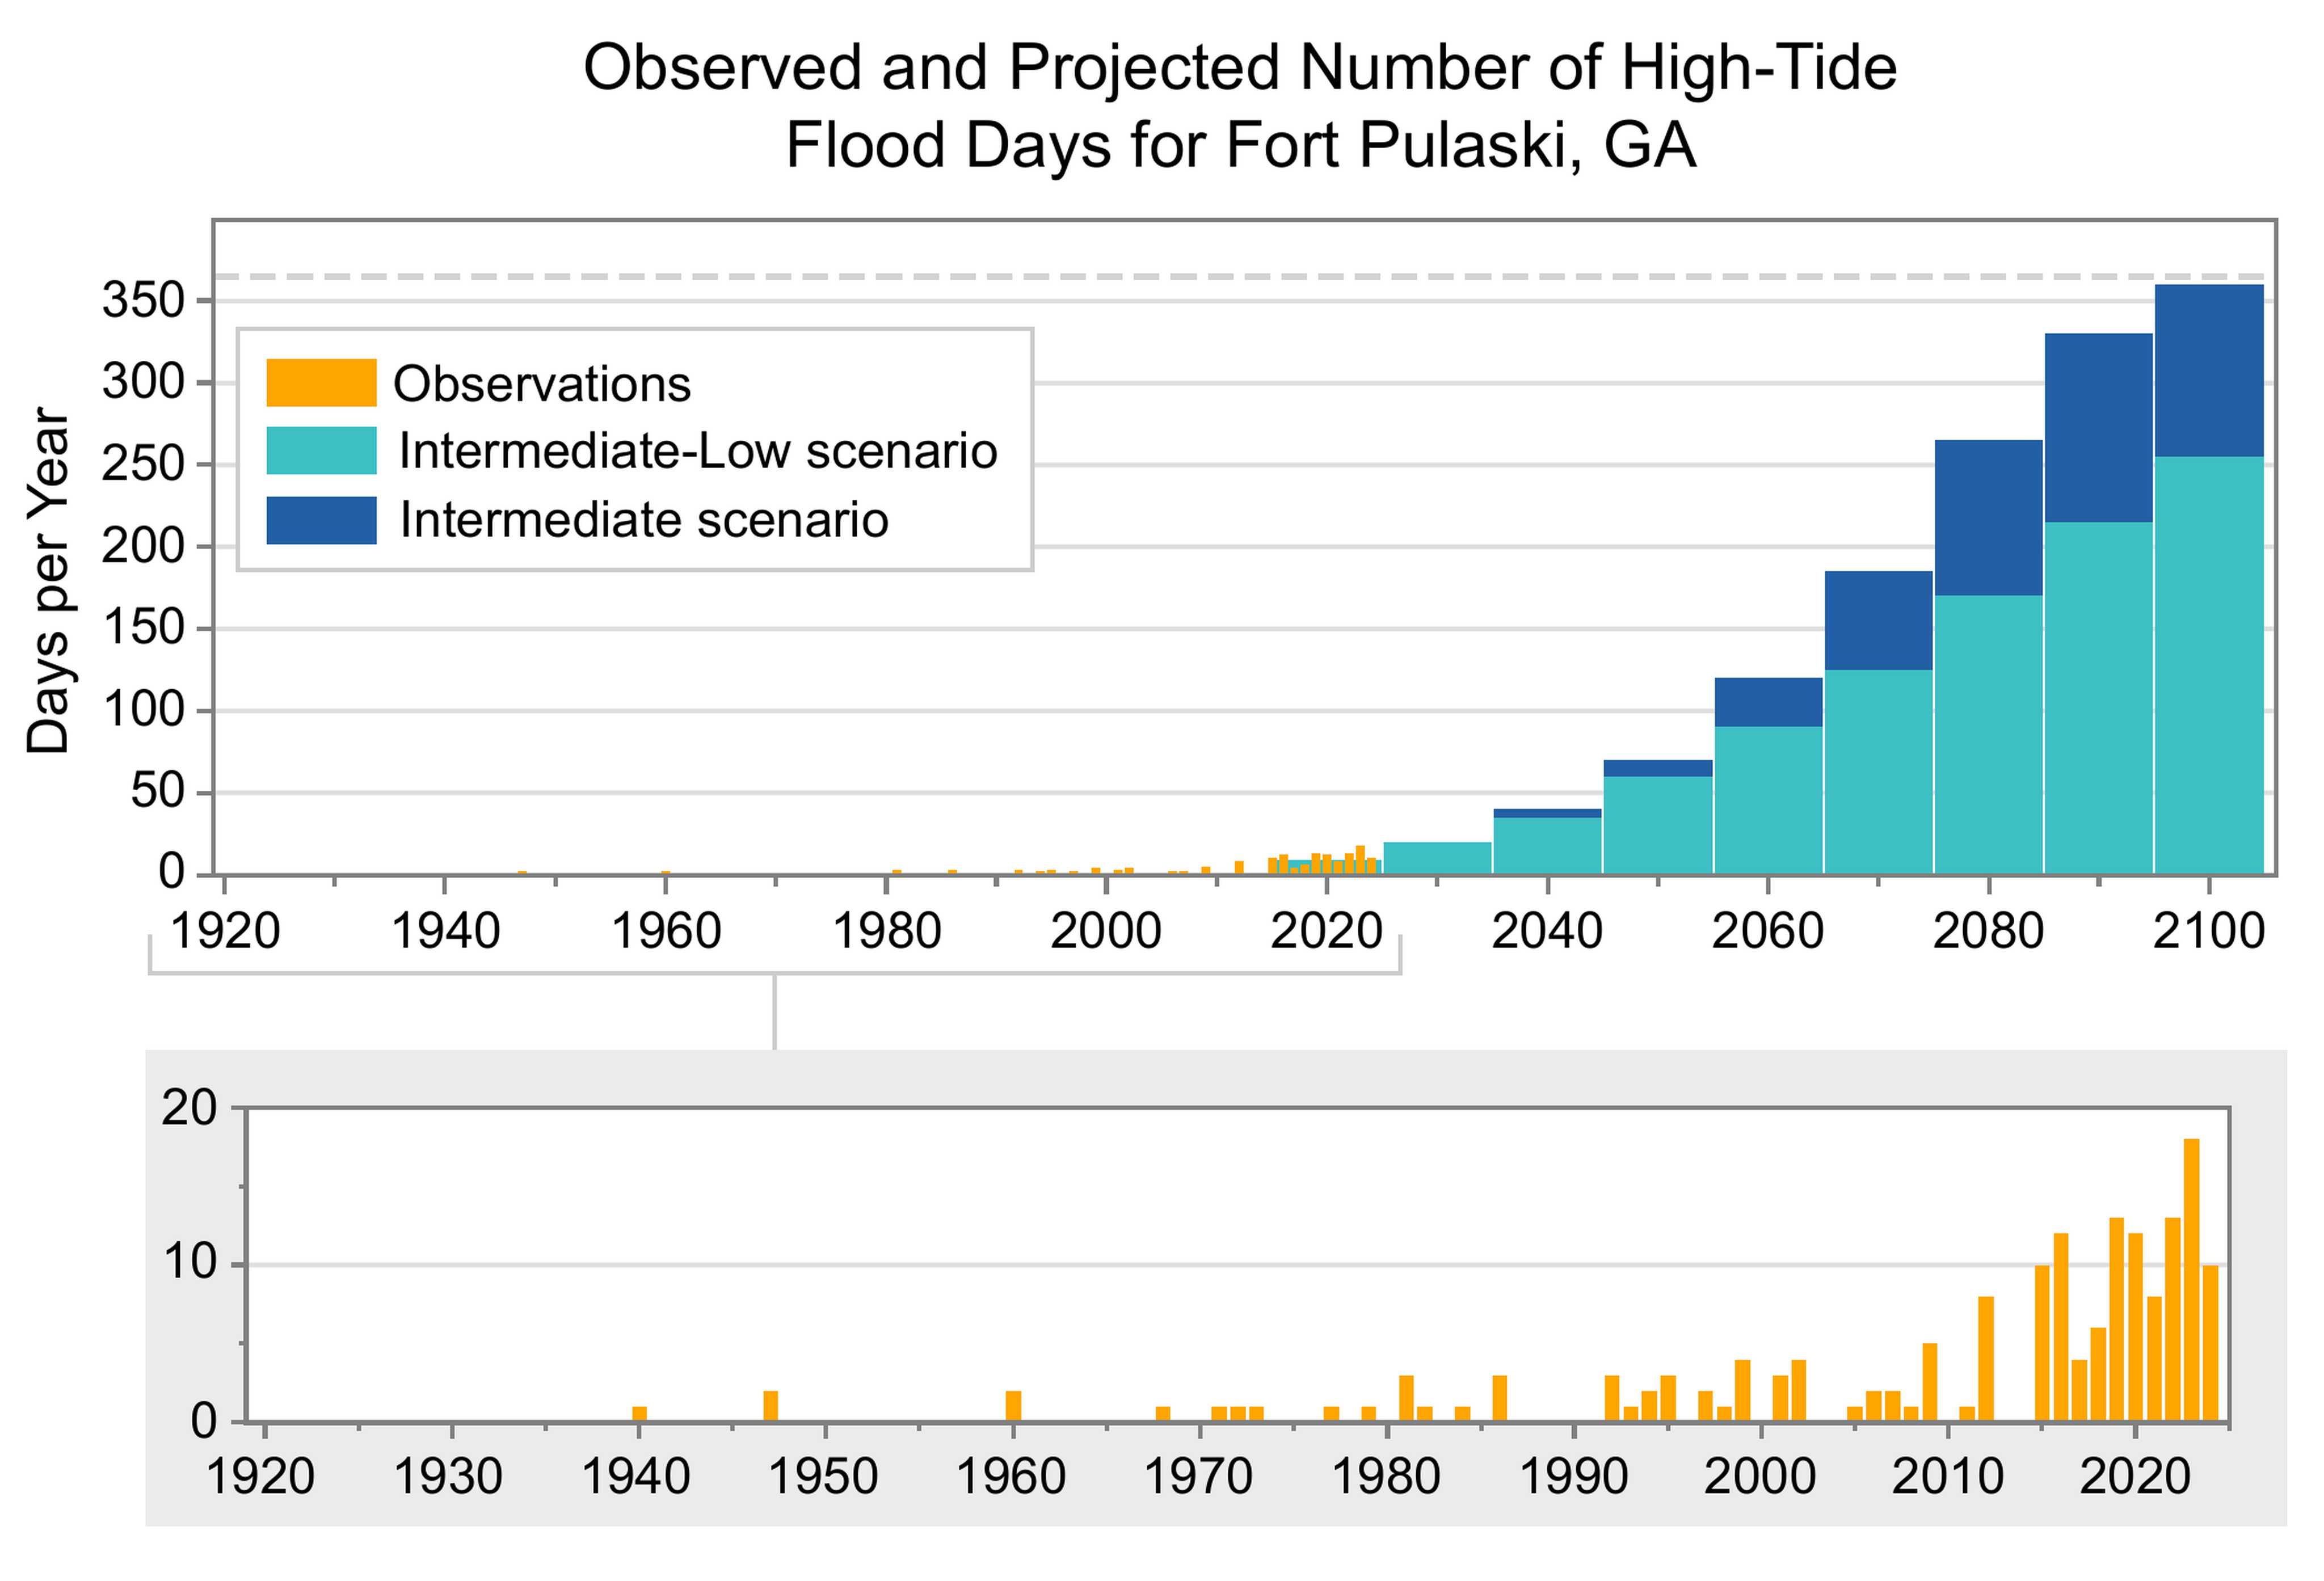
Graph of the observed and projected annual number of high-tide flood days at Fort Pulaski, Georgia, from 1935 to 2100 (top), including a magnified view of the observed data for the period 1935 to 2024 (bottom), as described in the caption.
A legend shows annual observations (orange bars) and projected 19-year averages (two-colored bars) for the Intermediate-Low (medium blue) and Intermediate (dark blue) sea level scenarios.
Bottom
Y-axis values for the magnified view range from 0 to 20 days per year. Following the first recorded event in 1940, high-tide flooding was sporadic until the early 1990s, with lengthy gaps of up to 12 years between events and annual values all below 4 days. Between the early 1990s and early 2010s, high-tide flood days increased in frequency and number. Starting in 2015, high-tide flood days occurred every year, with a record high of 18 days in 2023.
Top
Y-axis labels range from 0 to 350 days, with a horizontal dashed gray line indicating 365 days. Fort Pulaski is projected to experience 60 to 70 high-tide flood days per year by 2050 under the Intermediate-Low and Intermediate scenarios, respectively, and 255 to 360 days by 2100.
SOURCES
- CO-OPS, n.d.: Tides & Currents. National Oceanic and Atmospheric Administration, Center for Operational Oceanographic Products and Services, accessed September 12, 2025. https://tidesandcurrents.noaa.gov
- Fritz, A., 2017: Get ready for higher fruit prices—the freeze devastated some crops in the South. Washington Post, March 21, 2017. https://www.washingtonpost.com/news/capital-weather-gang/wp/2017/03/21/get-ready-for-higher-fruit-prices-the-freeze-devastated-some-crops-in-the-south/
- GDA, 2023: USDA designates 18 Georgia counties as primary natural disaster areas following March freezes. Georgia Department of Agriculture, Atlanta, GA, June 27, 2023. https://agr.georgia.gov/pr/usda-designates-18-georgia-counties-primary-natural-disaster-areas-following-march-freezes
- Hagen, A.B., J.P. Cangialosi, M. Chenard, L. Alaka, and S. Delgado, 2025: Tropical Cyclone Report: Hurricane Helene, 24–27 September 2024. AL092024. National Oceanic and Atmospheric Administration, National Hurricane Center, 107 pp. https://www.nhc.noaa.gov/data/tcr/AL092024_Helene.pdf
- Kunkel, K.E., L.E. Stevens, S.E. Stevens, L. Sun, E. Janssen, D. Wuebbles, C.E.K. II, C.M. Fuhrman, B.D. Keim, M.C. Kruk, A. Billet, H. Needham, M. Schafer, and J.G. Dobson, 2013: Regional Climate Trends and Scenarios for the U.S. National Climate Assessment Part 2. Climate of the Southeast. U.S. NOAA Technical Report NESDIS 142-2. National Oceanic and Atmospheric Administration, National Environmental Satellite, Data, and Information Service, Silver Spring, MD, 95 pp. https://repository.library.noaa.gov/view/noaa/56807
- McCallum, B.E. and A.J. Gotvald, 2010: Historic Flooding in Northern Georgia, September 16–22, 2009. Fact Sheet 2010-3061. U.S. Geological Survey, South Atlantic Water Science Center, 3 pp. https://doi.org/10.3133/fs20103061
- MRCC, n.d.: cli-MATE: MRCC Application Tools Environment. Midwestern Regional Climate Center, accessed September 12, 2025. https://mrcc.purdue.edu/newclimate
- NCDC, n.d.: Climate of Georgia. National Oceanic and Atmospheric Administration, National Climatic Data Center, Asheville, NC, 6 pp. https://www.ncei.noaa.gov/data/climate-normals-deprecated/access/clim60/states/Clim_GA_01.pdf
- NCEI, n.d.: Climate at a Glance. National Oceanic and Atmospheric Administration, National Centers for Environmental Information, accessed September 12, 2025. https://www.ncei.noaa.gov/access/monitoring/climate-at-a-glance/
- NCEI, n.d.: National Climate Report. National Oceanic and Atmospheric Administration, National Centers for Environmental Information, accessed September 12, 2025. https://www.ncei.noaa.gov/access/monitoring/monthly-report/national
- NCEI, n.d.: State Climate Extremes Committee (SCEC) Records—Georgia. National Oceanic and Atmospheric Administration, National Centers for Environmental Information, accessed September 12, 2025. https://www.ncei.noaa.gov/access/monitoring/scec/records/ga/all
- NCEI, n.d.: U.S. Climate Normals. National Oceanic and Atmospheric Administration, National Centers for Environmental Information, accessed September 12, 2025. https://www.ncei.noaa.gov/products/land-based-station/us-climate-normals
- NDMC, n.d.: U.S. Drought Monitor. National Drought Mitigation Center, Lincoln, NE, accessed September 12, 2025. https://droughtmonitor.unl.edu/
- NIDIS, n.d.: National Conditions: Georgia. National Oceanic and Atmospheric Administration, National Integrated Drought Information System, accessed September 12, 2025. https://www.drought.gov/states/georgia
- NWS, n.d.: Annual U.S. Killer Tornado Statistics: Map Killer Tornadoes by Year (1991–2024). National Oceanic and Atmospheric Administration, National Weather Service, Storm Prediction Center, accessed September 12, 2025. https://www.spc.noaa.gov/climo/torn/fatalmap.php#
- NWS, n.d.: Catastrophic Atlanta Flood of 2009. National Oceanic and Atmospheric Administration, National Weather Service, Atlanta/Peachtree City Weather Forecast Office, Peachtree City, GA, accessed September 12, 2025. https://www.weather.gov/ffc/atlanta_floods_anniv
- NWS, n.d.: EF4 Tornadoes in Georgia. National Oceanic and Atmospheric Administration, National Weather Service, Atlanta/Peachtree City Weather Forecast Office, Peachtree City, GA, accessed September 12, 2025. https://www.weather.gov/ffc/ef4tornado_history
- NWS, n.d.: Epic Floods of 2009. National Oceanic and Atmospheric Administration, National Weather Service, Atlanta/Peachtree City Weather Forecast Office, Peachtree City, GA, accessed September 12, 2025. https://www.weather.gov/ffc/0909epicflood
- NWS, n.d.: Hurricane Michael Hits Georgia. National Oceanic and Atmospheric Administration, National Weather Service, Atlanta/Peachtree City Weather Forecast Office, Peachtree City, GA, accessed September 12, 2025. https://www.weather.gov/ffc/2018_hurricane_michael
- NWS, n.d.: OHD/HL—Surveys/Alberto: Executive Summary. National Oceanic and Atmospheric Administration, National Weather Service, Office of Water Prediction, Silver Spring, MD, accessed September 12, 2025. https://www.weather.gov/owp/oh_hrl_surveys_alberto_execsum
- NWS, n.d.: Summary of Storm Damage Surveys From the April 5/6, 2022 Tornado Outbreak. National Oceanic and Atmospheric Administration, National Weather Service, Charleston Weather Forecast Office, Charleston, SC, accessed September 12, 2025. https://www.weather.gov/chs/TornadoOutbreak_April2022
- NWS, n.d.: What's Typical in North and Central Georgia? National Oceanic and Atmospheric Administration, National Weather Service, Atlanta/Peachtree City Weather Forecast Office, Peachtree City, GA, accessed September 12, 2025. https://www.weather.gov/ffc/clisumlst
- OCM, n.d.: U.S. Sea Level Change: National Sea Level Explorer. National Oceanic and Atmospheric Administration, Office for Coastal Management, accessed September 12, 2025. https://earth.gov/sealevel/us/national-sea-level-explorer/
- SSRC, n.d.: SSRC Seeks to Increase Georgia’s Defenses Against Twisters. Georgia Institute of Technology, Severe Storms Research Center, Atlanta, GA, accessed September 12, 2025. https://severestorms.gatech.edu/tornado-tally-severe-storms-research-center-seeks-increase-georgias-defenses-against-twisters
- Sweet, W.V., G. Dusek, J. Obeysekera, and J.J. Marra, 2018: Patterns and Projections of High Tide Flooding Along the U.S. Coastline Using a Common Impact Threshold. NOAA Technical Report NOS CO-OPS 086. National Oceanic and Atmospheric Administration, National Ocean Service, Center for Operational Oceanographic Products and Services, Silver Spring, MD, 56 pp. https://tidesandcurrents.noaa.gov/publications/techrpt86_PaP_of_HTFlooding.pdf
- Sweet, W.V., B.D. Hamlington, R.E. Kopp, C.P. Weaver, P.L. Barnard, D. Bekaert, W. Brooks, M. Craghan, G. Dusek, T. Frederikse, G. Garner, A.S. Genz, J.P. Krasting, E. Larour, D. Marcy, J.J. Marra, J. Obeysekera, M. Osler, M. Pendleton, D. Roman, L. Schmied, W. Veatch, K.D. White, and C. Zuzak, 2022: Global and Regional Sea Level Rise Scenarios for the United States: Updated Mean Projections and Extreme Water Level Probabilities Along U.S. Coastlines. NOAA Technical Report NOS 01. National Oceanic and Atmospheric Administration, National Ocean Service, Silver Spring, MD, 111 pp. https://earth.gov/sealevel/us/internal_resources/756/noaa-nos-techrpt01-global-regional-SLR-scenarios-US.pdf
- USGCRP, 2017: Climate Science Special Report: Fourth National Climate Assessment, Volume I. Wuebbles, D.J., D.W. Fahey, K.A. Hibbard, D.J. Dokken, B.C. Stewart, and T.K. Maycock, Eds. U.S. Global Change Research Program, Washington, DC, USA, 470 pp. https://repository.library.noaa.gov/view/noaa/19486
- USGCRP, 2018: Impacts, Risks, and Adaptation in the United States: Fourth National Climate Assessment, Volume II. Reidmiller, D.R., C.W. Avery, D.R. Easterling, K.E. Kunkel, K.L.M. Lewis, T.K. Maycock, and B.C. Stewart, Eds. U.S. Global Change Research Program, Washington, DC, USA, 1515 pp. https://repository.library.noaa.gov/view/noaa/19487
- USGCRP, 2023: Fifth National Climate Assessment. Crimmins, A.R., C.W. Avery, D.R. Easterling, K.E. Kunkel, B.C. Stewart, and T.K. Maycock, Eds. U.S. Global Change Research Program, Washington, DC, USA. https://repository.library.noaa.gov/view/noaa/61592