Michigan experiences large seasonal changes in temperature, with warm, humid summers and cold winters. Annual average temperature varies widely across the state, with a range of about 10°F from the Upper Peninsula to southern portions of the Lower Peninsula. Typical summer maximum temperatures range from the low 70s (°F) in northernmost parts of the state to mid-80s in parts of the Lower Peninsula (1991–2020 averages). Average winter minimum temperatures range from less than 5°F in parts of the Upper Peninsula to more than 20°F in southernmost portions of the state. The Great Lakes play an important role in moderating the state’s climate, causing it to be more temperate and humid than other north-central states. The Lower Peninsula is bordered by Lake Michigan to the west and by Lakes Huron and Erie to the east, while the Upper Peninsula is bounded by Lake Superior to the north and Lakes Huron and Michigan to the east and south, respectively. The moderating effect of the lakes is most evident along the shores, which are considerably warmer during the winter and cooler in the summer than more inland locations. The moderating effects in summer are even greater along the shores of the colder waters of Lake Superior in the Upper Peninsula. Annual precipitation generally ranges from about 30 to 42 inches across the state, with the largest totals observed in southwest portions of the Lower Peninsula.

Time series of observed and projected temperature change (in degrees Fahrenheit) for Michigan from 1900 to 2100 as described in the caption.
Y-axis values range from negative 8 to positive 24 degrees. Observed annual temperatures from 1900 to 2024 show variability and range from negative 4.3 to positive 5.5 degrees. By the end of the century, projected increases in temperature range from 2.8 to 9.9 degrees under the lower emissions pathway, from 5.0 to 12.0 degrees under the intermediate pathway, and from 9.8 to 19.7 degrees under the higher pathway
.Annual average temperatures in Michigan have increased more than 3°F since the beginning of the 20th century (Figure 1). Temperatures in the 2000s have generally been higher than in any other historical period, with each successive 5-year average being warmer than the previous one. The year 2024 was the hottest on record, with a statewide annual average temperature of 48.8°F, which is 4.9°F above the long-term (1895–2024) average. Warming has been most notable in winter and spring, with summer temperatures also being above average in recent decades (Figures 2a and 2b). Despite this summer warming, extreme heat events have not increased, which is reflected in a generally below-average number of hot days since the 1960s (Figure 3a) and no overall trend in warm nights (Figure 3b). The winter warming trend is reflected in a generally below-average number of very cold nights since the 1990s (Figure 4) and reduced ice cover in the Great Lakes. Annual maximum ice cover across the Great Lakes as a whole fluctuates from year to year but has shown a decreasing trend since records began in 1973. The 2024 annual maximum ice cover for the Great Lakes combined was the fourth lowest on record at 16%, compared to the 1973–2025 average of 52%. The 2025 maximum ice cover, however, was equal to the long-term average at 52%.
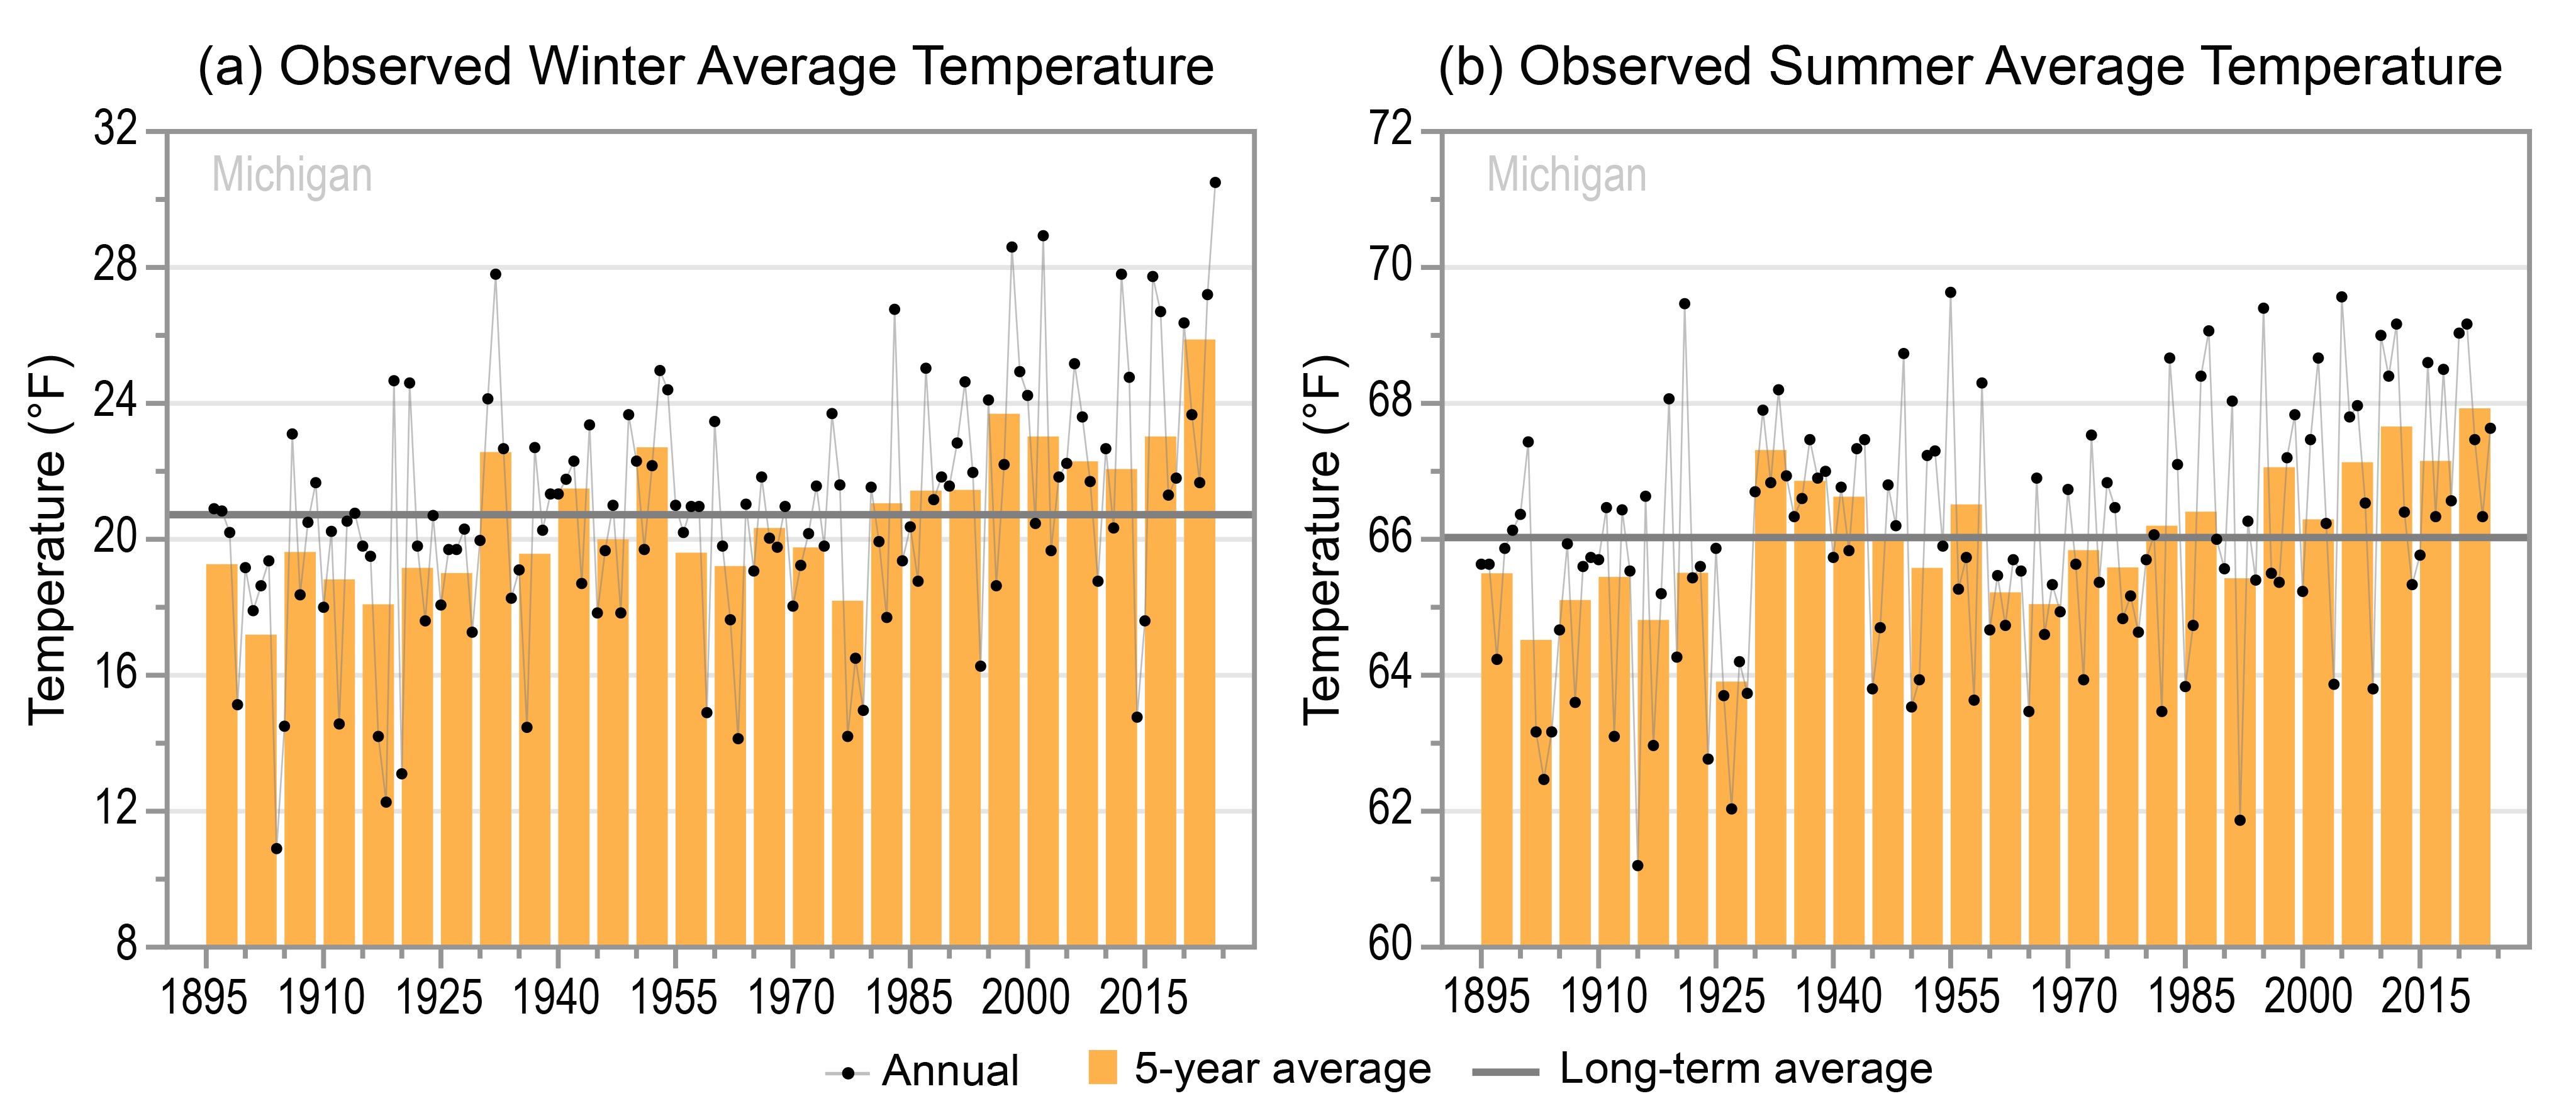
Two graphs of the observed (a) winter and (b) summer average temperatures for Michigan from 1895–96 to 2023–24 and 1895 to 2024, respectively, as described in the caption.
Panel A: Winter Average Temperature
Y-axis values range from 8 to 32 degrees Fahrenheit. Annual values show year-to-year variability and range from 10.9 to 30.5 degrees. Five-year values also show variability and are mostly below the long-term average of 20.7 degrees between 1895 and 1979. Exceptions include the 1930 to 1934 and 1950 to 1954 periods. Since 1980, 5-year values are all above average. The 1900 to 1904 period has the lowest 5-year value at 17.2 degrees, and the 2020 to 2024 period has the highest at 25.9 degrees.
Panel B: Summer Average Temperature
Y-axis value range from 60 to 72 degrees Fahrenheit. Annual values show year-to-year variability and range from 61.2 to 69.6 degrees. Five-year values also show variability, and are all below the long-term average of 66.0 degrees between 1895 and 1929, all near or above average between 1930 and 1959 except for the 1950 to 1954 period, and all below average between 1960 and 1979. Since 1980, 5-year values are all near or above average except for the 1990 to 1994 period. The 1925 to 1929 period has the lowest 5-year value at 63.9 degrees, and the 2020 to 2024 period has the highest at 67.9 degrees.

Two graphs of the observed annual number of (a) hot days and (b) warm nights for Michigan from 1900 to 2024 as described in the caption.
Panel A: Hot Days
Y-axis values range from 0 to 28 days. Annual values show year-to-year variability and range from 0.1 to 26.5 days. Five-year values also show variability and mostly above the long-term average of 6.8 days between 1900 and 1959 but are all below average since 1960 except for the 1985 to 1989 period. The 1980 to 1984 period has the lowest 5-year value at 3.4 days, and the 1930 to 1934 period has the highest at 16.1 days.
Panel B: Warm Nights
Y-axis values range from 0 to 10 nights. Annual values show year-to-year variability and range from 0 to 8.1 nights. Five-year values also show variability and are all below the long-term average of 2.3 nights between 1900 and 1929 except for the 1915 to 1919 period, all above average between 1930 and 1949, and mostly below average since 1950. The 1905 to 1909 period has the lowest 5-year value at 0.9 nights, and the 1930 to 1934 period has the highest at 4.2 nights.

Graph of the observed annual number of very cold nights for Michigan from 1900 to 2024 as described in the caption.
Y-axis values range from 0 to 36 nights. Annual values show year-to-year variability and range from 1.4 to 32.1 nights. Five-year values also show variability and are all near or above the long-term average of 11.5 nights between 1900 and 1924, all below average between 1925 and 1959, and all near or above average between 1960 and 1994. Since 1995, all 5-year values are below average. The 2020 to 2024 period has the lowest 5-year value at 4.6 nights, and the 1975 to 1979 period has the highest at 17.0 nights.
Statewide annual precipitation has ranged from a low of 22.7 inches in 1930 to a high of 41.8 inches in 2019 and shows an upward trend (Figure 5). The frequency of extreme precipitation events has risen steadily since the early 2000s; 5-year averages for 2-inch extreme precipitation events between 2010 and 2024 are the highest on record (Figure 6).

Graph of the observed total annual precipitation for Michigan from 1895 to 2024 as described in the caption.
Y-axis values range from 20 to 44 inches. Annual values show year-to-year variability and range from 22.7 to 41.8 inches. Five-year values also show variability and are all near or below the long-term average of 31.7 inches between 1895 and 1964 except for the 1950 to 1954 period. Since 1965, 5-year values are all near or above average except for the 1995 to 1999 period. The 1930 to 1934 period has the lowest 5-year value at 28.1 inches, and the 2015 to 2019 period has the highest at 37.0 inches.
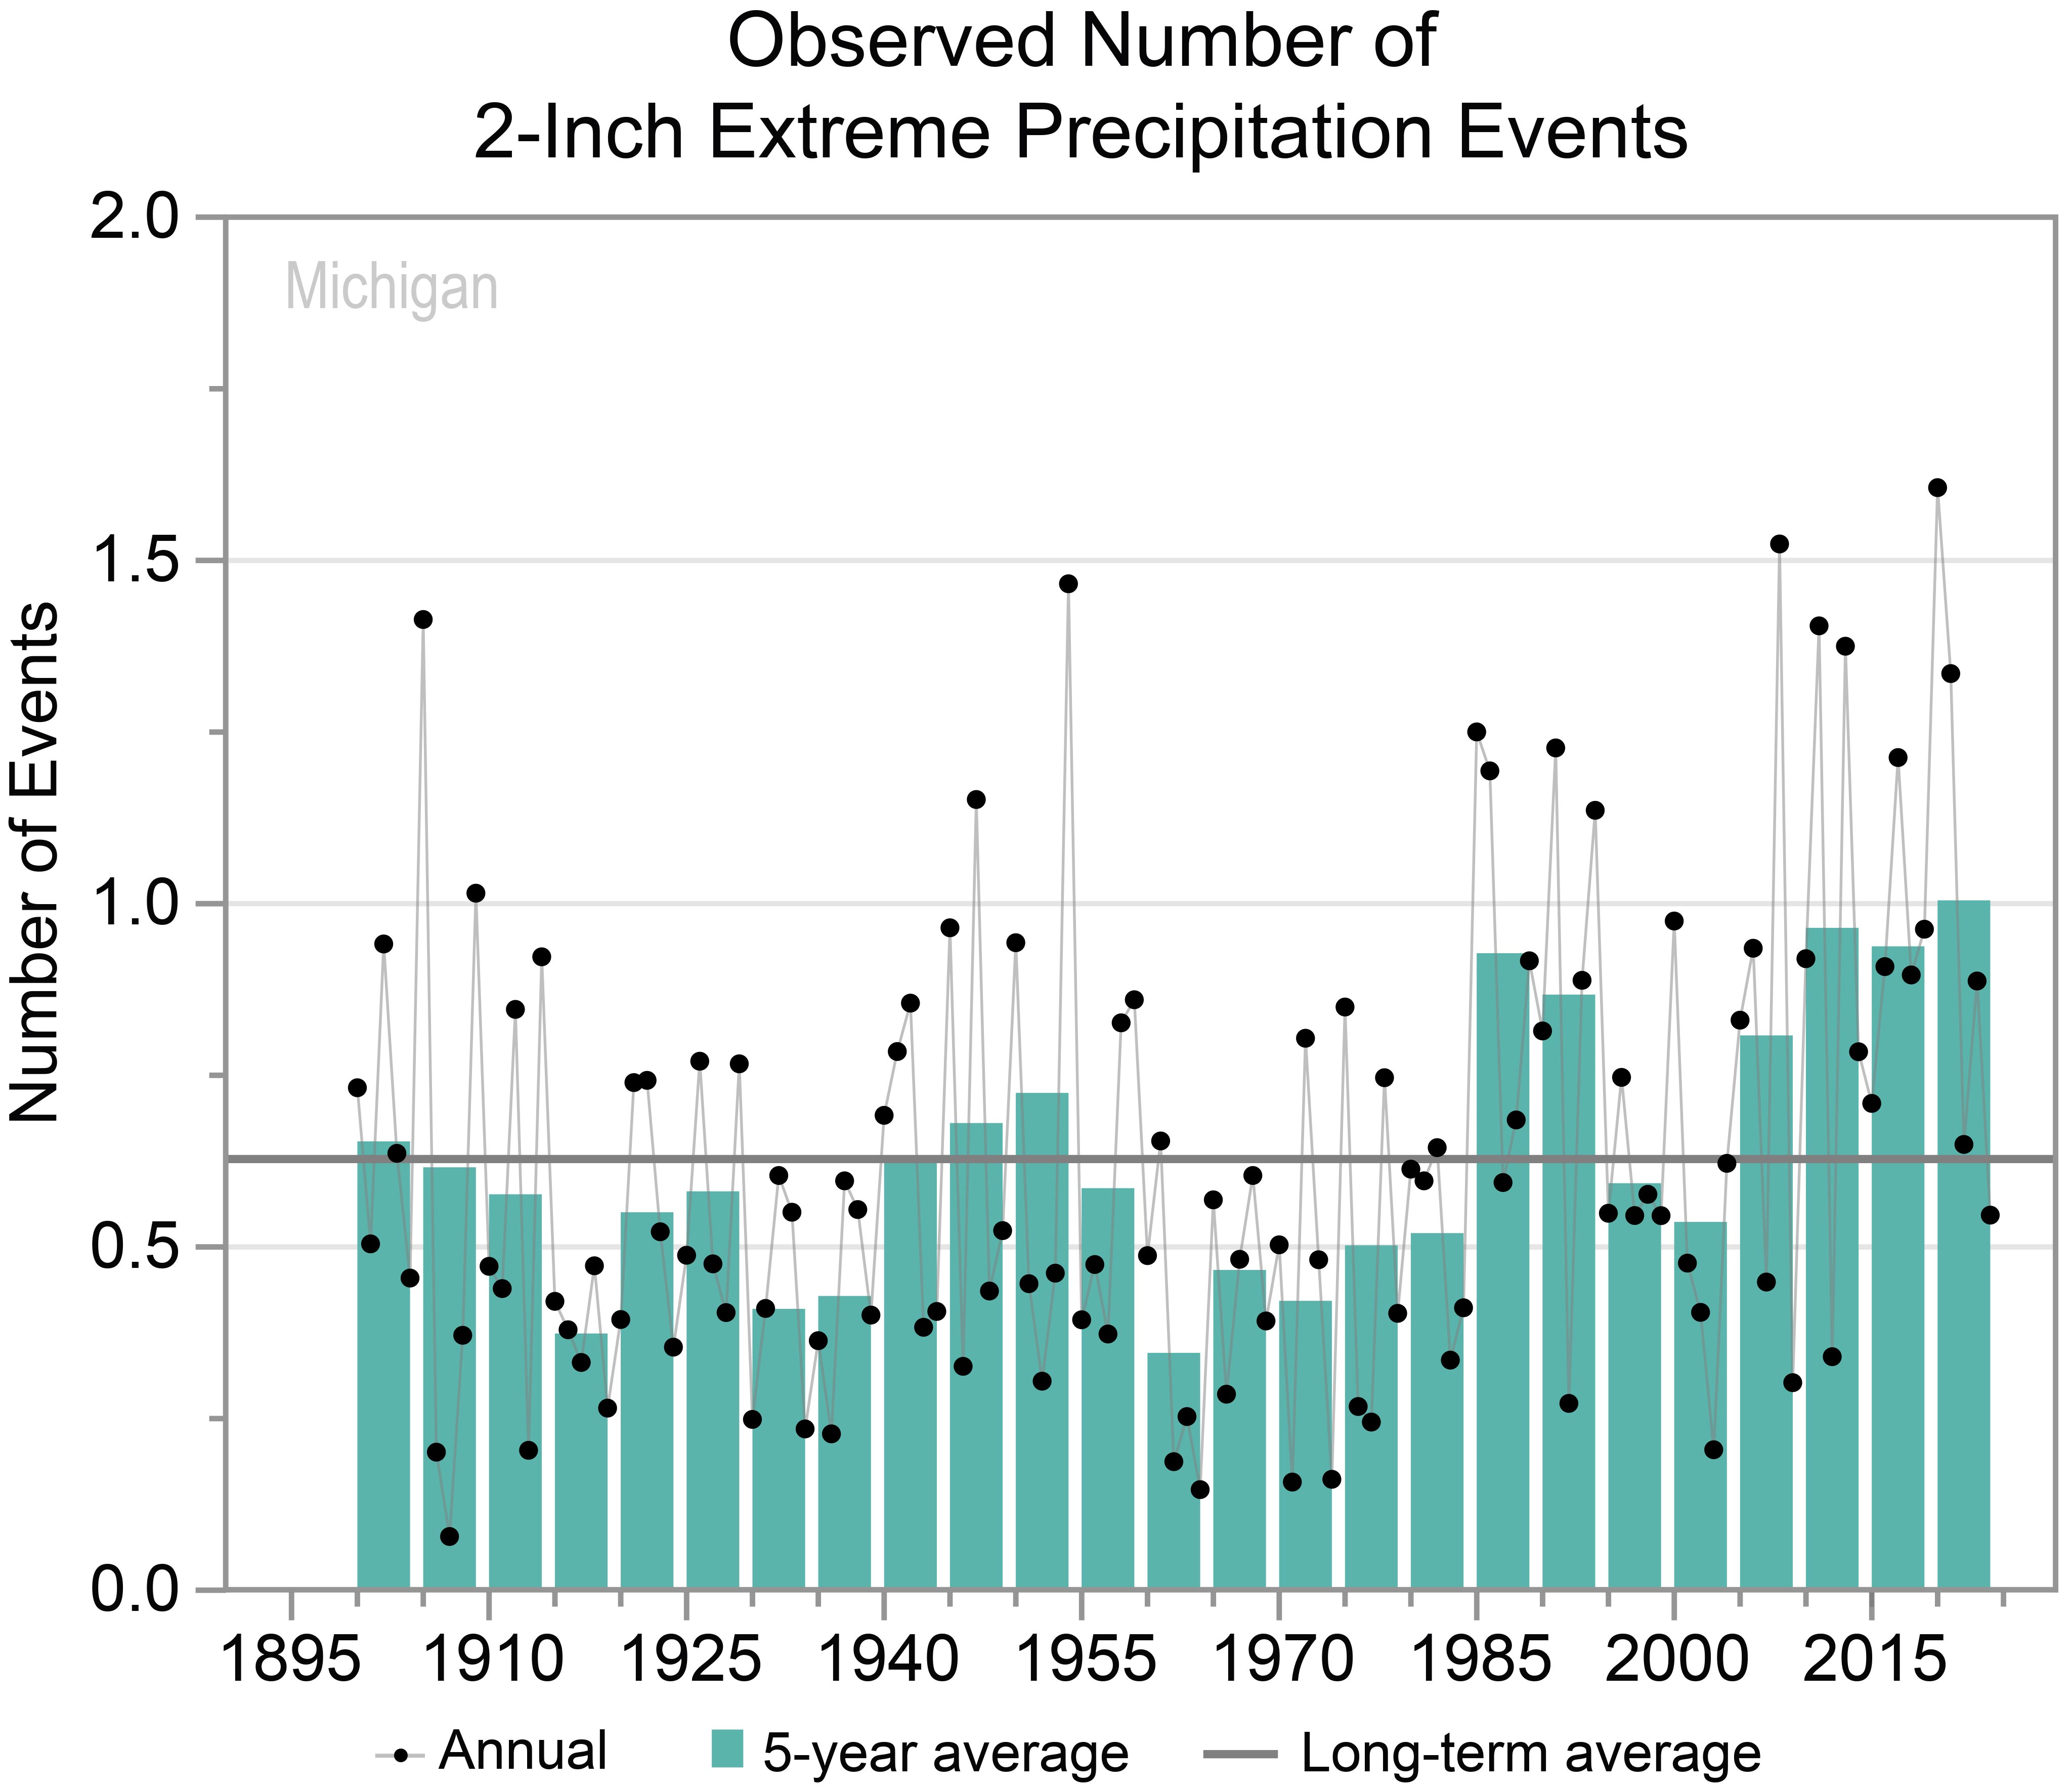
Graph of the observed annual number of 2-inch extreme precipitation events for Michigan from 1900 to 2024 as described in the caption.
Y-axis values range from 0.0 to 2.0 events. Annual values show year-to-year variability and range from 0.1 to 1.6 events. Five-year values also show variability and are mostly near or below the long-term average of 0.6 events between 1900 and 1984 but are all above average since 1985 except for the 1995 to 1999 and 2000 to 2004 periods. The 1960 to 1964 period has the lowest 5-year value at 0.3 events, and the 2020 to 2024 period has the highest at 1.0 events.
Michigan experiences severe thunderstorms, some of which produce tornadoes—which are not as common in the state as elsewhere in the Midwest—and flooding. The deadliest tornado in the state’s history—and the 10th deadliest in US history—was an EF5 that struck Flint on June 8, 1953, killing 116 people. On May 31, 1998, a powerful derecho (a widespread, long-lived straight-line windstorm associated with a series of severe thunderstorms) with wind gusts over 100 mph struck lower Michigan, causing 4 deaths and destroying 250 homes and 34 businesses. Heavy rainfall events have led to several impactful flooding episodes in recent years. In April 2013, significant flooding occurred in the Grand Rapids area when heavy rain fell on saturated ground and caused the Grand River to rise to record levels. More than 1,200 homes were damaged, and losses exceeded $43 million. Historic flooding also occurred during May 17–20, 2020, in central Michigan due to persistent rainfall over several days. This caused catastrophic failures of multiple dams, resulting in record-breaking flooding along the Tittabawassee River.
Snowfall is common in the state but varies regionally. Due to their proximity to the Great Lakes, the south shore of Lake Superior in the Upper Peninsula and the eastern shore of Lake Michigan in the Lower Peninsula receive much more snowfall than the rest of the state. Parts of the Upper Peninsula receive more than 200 inches annually (1991–2020 average). Notable snowstorms include the Blizzard of 1967, which paralyzed southern portions of the state with 20–30 inches of snow, and the New Year’s storm of January 1999, which brought 18–24 inches to the same region.
Changes in seasonal and multiyear precipitation, evaporation, and temperature can affect water levels in the Great Lakes, causing serious environmental and socioeconomic impacts. Extreme high lake levels can damage beaches, erode shorelines, and flood and damage nearshore structures. Low lake levels can affect the supply and quality of water, restrict shipping, and result in the loss of wetlands. Reduced winter ice cover from rising temperatures also leaves shores vulnerable to erosion and flooding. Water levels in the Great Lakes have fluctuated widely since the early 20th century. For Lake Michigan–Huron (Figure 7), levels were generally high in the early 20th century, early 1950s, early 1970s, mid-1980s, and late 2010s. Levels were lowest in the mid-1920s, mid-1930s, mid-1960s, and, for an extended period, in the early 2000s to mid-2010s—averaging 577.5 feet over 2000–2013. Lake levels rose rapidly after that, reaching a record high of 581.7 feet in 2020 before dropping off to early-1990s levels by 2023.
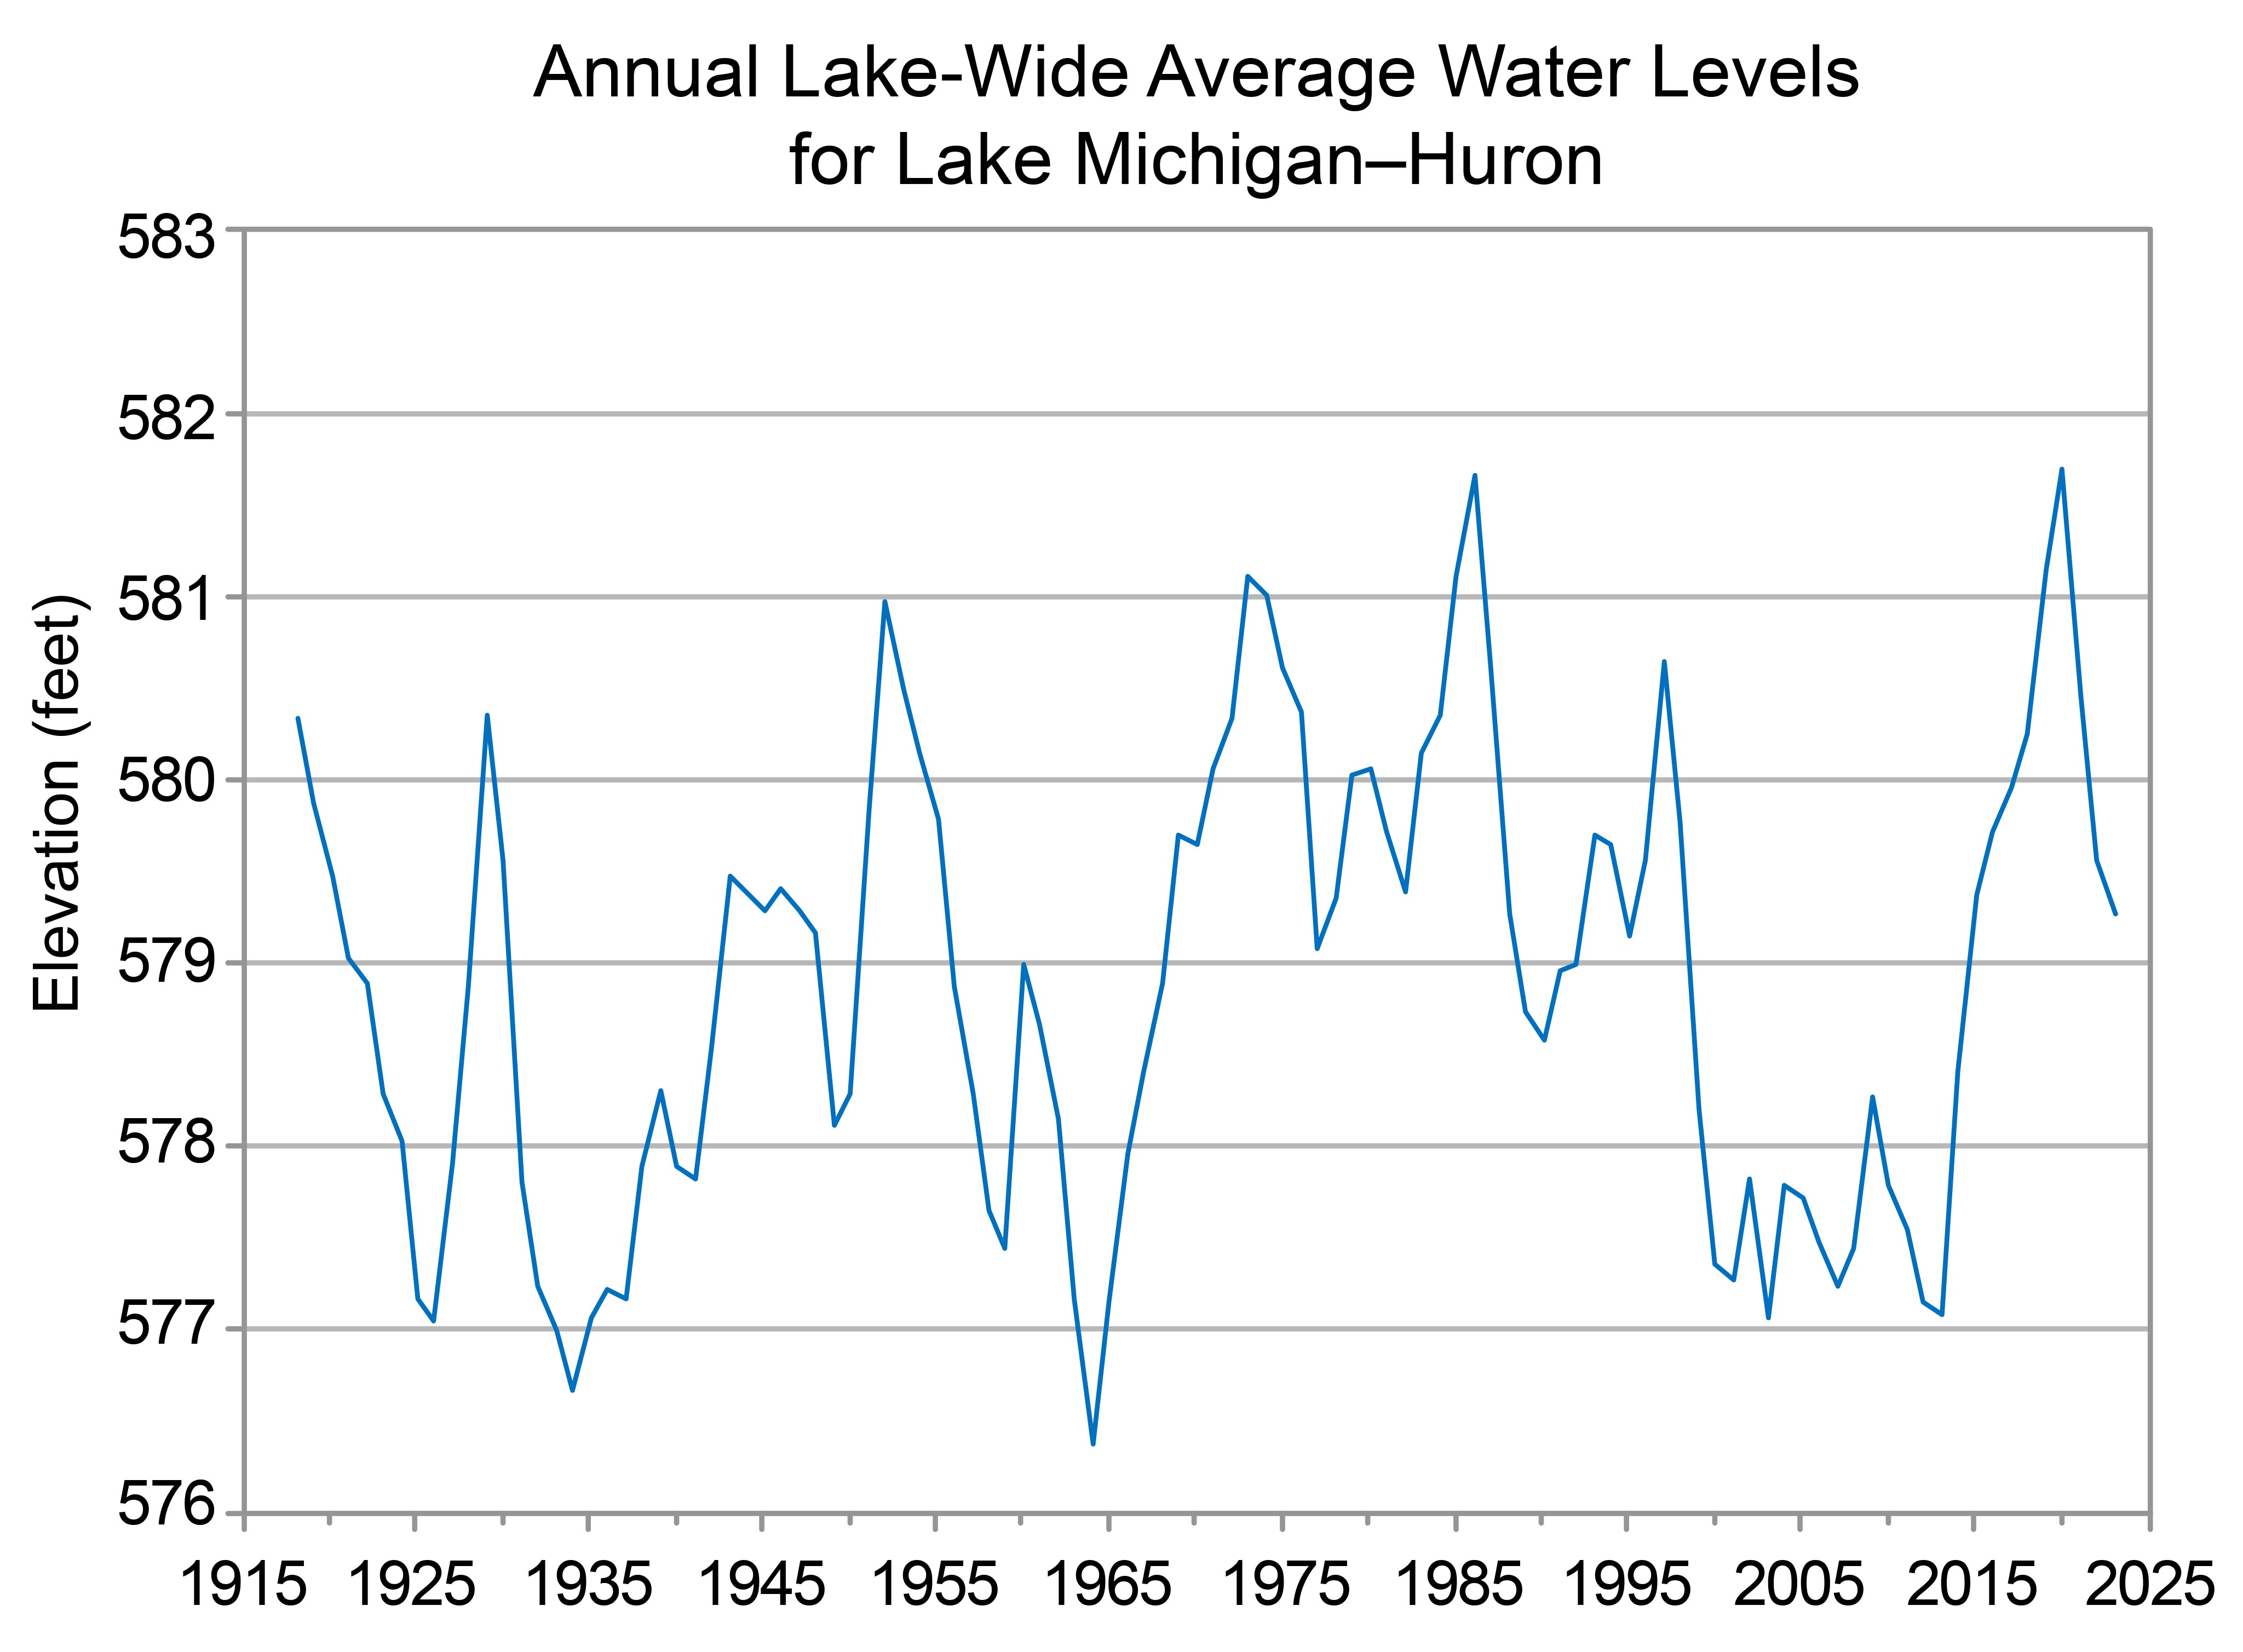
Time series of annual average water levels for Lake Michigan–Huron from 1918 to 2023 as described in the caption.
Y-axis values range from 576 to 583 feet. Annual values show wide variability and range from a high of nearly 582 feet in 1986 and 2020 to a low of about 576 feet in 1964. Annual values are mostly between 577 and 579 feet from the beginning of the period to the late 1960s but are mostly between 579 and 581 feet from the early 1970s to late 1990s. The 2000s through the early 2010s show consistently low water levels between 577 and 578 feet. Levels rose sharply early 2010s show consistently low water levels between 577 and 578 feet. Levels rose sharply in the late 2010s to nearly 582 feet in 2020 but then dropped to nearly 579 feet by 2023.
Under the intermediate and higher emissions pathways, historically unprecedented warming is projected during this century (Figure 1). Even under the lower emissions pathway, most projections show annual average temperatures exceeding historical levels by the middle of the century. However, projections for all three pathways show a large range of potential temperature increases, and some projections for the lower pathway are comparable to recent observed values. Extreme heat is a particular concern for Detroit and other urban areas. Heat absorbed and emitted by buildings and pavement, as well as other aspects of urban environments, makes cities even warmer than the surrounding countryside, a phenomenon known as the urban heat island effect. Detroit recorded its highest annual average temperature at 54.1°F in 2024. Higher spring temperatures are expected to lengthen the growing season but also potentially increase the risk of spring freeze damage. In 2012, record-high March temperatures caused Michigan’s fruit trees to bloom early. When temperatures dropped back down to below freezing in April, the budding fruit crop was destroyed, causing exceptionally large losses in the hundreds of millions of dollars.
Under the intermediate emissions pathway, statistically significant increases in total winter precipitation are projected across most of Michigan by midcentury (Figure 8). Statistically significant increases are also projected for annual precipitation (across the eastern edge of the Upper Peninsula and central and eastern portions of the Lower Peninsula) and spring precipitation (across most of the Upper peninsula and northern and eastern portions of the Lower Peninsula). There is uncertainty in projections for summer and fall precipitation. The frequency and intensity of extreme precipitation events are projected to increase, potentially increasing the frequency and intensity of floods. Springtime flooding, in particular, could threaten Michigan’s agricultural industry by delaying planting and reducing crop yields.
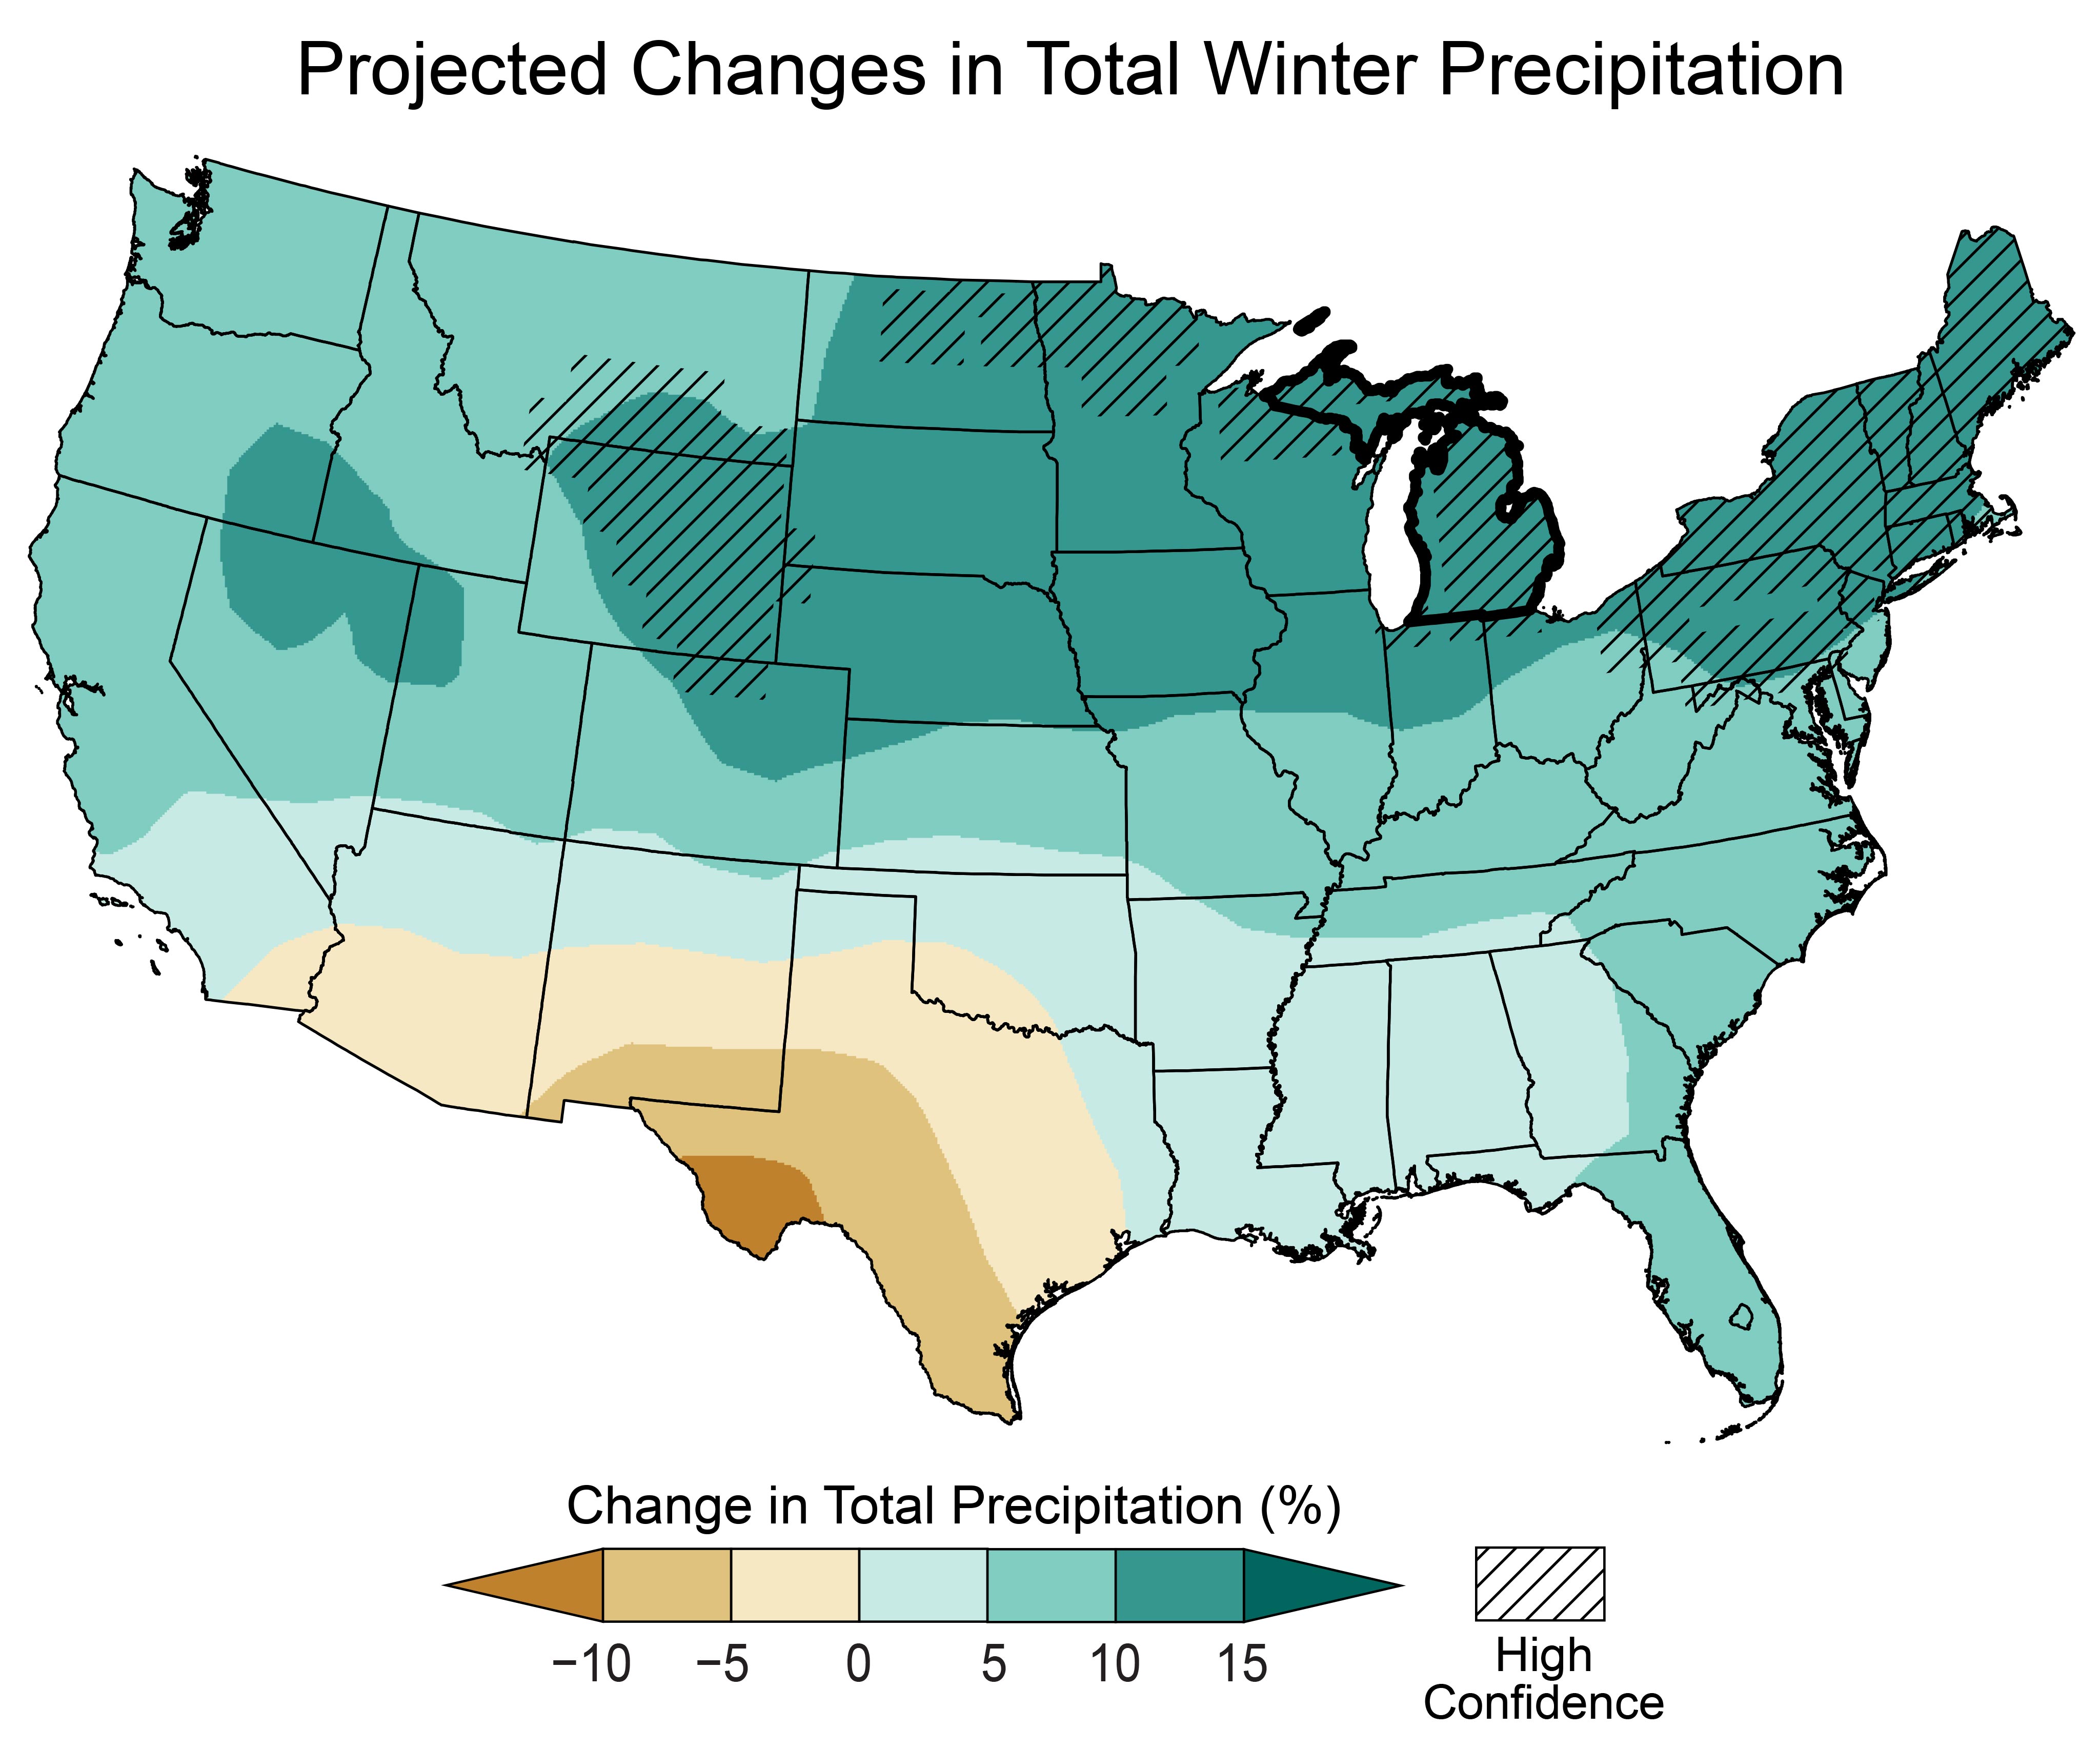
Map of the contiguous United States showing the projected changes in total winter precipitation by the middle of this century as described in the caption. The state of Michigan is outlined in black.
Legend values range from less than negative 10 to greater than positive 15 percent. Note: unless otherwise specified, projected values are not statistically significant.
Michigan
Nearly all of Michigan is projected to see statistically significant increases in total winter precipitation of 10 to 15 percent.
Contiguous US
Projected increases in total winter precipitation are as follows: up to 5 percent across a narrow swath running westward from western Georgia to southern California; 5 to 10 percent in the Southeast, Mid-Atlantic, southern Midwest, portions of the Great Plains and most of the West; and 10 to 15 percent in the majority of the Northeast and upper Midwest as well as portions of the northern Great Plains and Intermountain West, with statistically significant increases in the 10 to 15 percent range for the Northeast, the northernmost regions of the upper Midwest, and portions of the northern Great Plains.
Projected decreases are as follows: up to 5 percent for southern regions of the Southwest and northern and central Texas; 5 to 10 percent for southern New Mexico and western Texas; and 5 to 10 percent or greater for southwestern Texas.
Droughts, a natural part of Michigan’s climate, are projected to increase in intensity due to higher temperatures and the associated increase in evaporation rates and soil moisture loss.
SOURCES
- Bai, X. and J. Wang, 2012: Atmospheric teleconnection patterns associated with severe and mild ice cover on the Great Lakes, 1963–2011. Water Quality Research Journal, 47 (3–4), 421–435. https://doi.org/10.2166/wqrjc.2012.009
- Gaertner, E., n.d.: Blizzard of 1967: January 26th into the 27th. National Oceanic and Atmospheric Administration, National Weather Service, 7 pp. https://www.weather.gov/media/grr/BillHistorical/Blizzard%20of%201967.pdf
- GLERL, n.d.: Great Lakes Ice Cover. National Oceanic and Atmospheric Administration, Great Lakes Environmental Research Laboratory, Ann Arbor, MI, accessed June 27, 2025. https://www.glerl.noaa.gov/data/ice/
- GLERL, n.d.: Historical Ice Cover. National Oceanic and Atmospheric Administration, Great Lakes Environmental Research Laboratory, Ann Arbor, MI, accessed June 27, 2025. https://www.glerl.noaa.gov/data/ice/#historical
- GLISA, n.d.: Lake Levels. National Oceanic and Atmospheric Administration, Great Lakes Integrated Sciences and Assessments Center, accessed June 27, 2025. https://glisa.umich.edu/resources-tools/climate-impacts/lake-levels/
- Kunkel, K.E., L.E. Stevens, S.E. Stevens, L. Sun, E. Janssen, D. Wuebbles, S.D. Hilberg, M.S. Timlin, L. Stoecker, N.E. Westcott, and J.G. Dobson, 2013: Regional Climate Trends and Scenarios for the U.S. National Climate Assessment Part 3. Climate of the Midwest U.S. NOAA Technical Report NESDIS 142-3. National Oceanic and Atmospheric Administration, National Environmental Satellite, Data, and Information Service, Silver Spring, MD, 103 pp. https://repository.library.noaa.gov/view/noaa/56808
- MRCC, n.d.: cli-MATE: MRCC Application Tools Environment. Midwestern Regional Climate Center, accessed June 27, 2025. https://mrcc.purdue.edu/newclimate
- NCEI, n.d.: Climate at a Glance. National Oceanic and Atmospheric Administration, National Centers for Environmental Information, accessed June 27, 2025. https://www.ncei.noaa.gov/access/monitoring/climate-at-a-glance/
- NCEI, n.d.: National Climate Report. National Oceanic and Atmospheric Administration, National Centers for Environmental Information, accessed June 27, 2025. https://www.ncei.noaa.gov/access/monitoring/monthly-report/national
- NCEI, n.d.: U.S. Climate Normals. National Oceanic and Atmospheric Administration, National Centers for Environmental Information, accessed June 27, 2025. https://www.ncei.noaa.gov/products/land-based-station/us-climate-normals
- NWS, 2012: March Heat, April Freezes. National Oceanic and Atmospheric Administration, National Weather Service, Central Region Headquarters, Kansas City, MO, 6 pp. https://web.archive.org/web/20170125015419/http://www.crh.noaa.gov/Image/apx/SpringHeatFreeze.pdf
- NWS, n.d.: The 25 Deadliest U.S. Tornadoes. National Oceanic and Atmospheric Administration, National Weather Service, Storm Prediction Center, accessed June 27, 2025. https://www.spc.noaa.gov/faq/tornado/killers.html
- NWS, n.d.: 1999 Monster New Years Snowstorm. National Oceanic and Atmospheric Administration, National Weather Service, Northern Indiana Weather Forecast Office, Syracuse, IN, accessed June 27, 2025. https://www.weather.gov/iwx/19990102_snow
- NWS, n.d.: Flooding in Michigan. National Oceanic and Atmospheric Administration, National Weather Service, accessed June 27, 2025. https://www.weather.gov/safety/flood-states-mi
- NWS, n.d.: Historic Flooding May 17–20, 2020. National Oceanic and Atmospheric Administration, National Weather Service, Detroit/Pontiac Weather Forecast Office, accessed June 27, 2025. https://www.weather.gov/dtx/HistoricFlooding-May-17-20-2020
- NWS, n.d.: The Historic March Heat Wave. National Oceanic and Atmospheric Administration, National Weather Service, Detroit/Pontiac Weather Forecast Office, accessed June 27, 2025. https://www.weather.gov/dtx/unprecedentedmarchwarmth2012
- NWS, n.d.: May 30–31, 1998 Derecho, “The Southern Great Lakes Derecho of 1998”. National Oceanic and Atmospheric Administration, National Weather Service, Storm Prediction Center, Norman, OK, accessed June 27, 2025. https://www.spc.noaa.gov/misc/AbtDerechos/casepages/may30-311998page.htm
- NWS, n.d.: The Science Behind the Flint-Beecher Tornado. National Oceanic and Atmospheric Administration, National Weather Service, Detroit/Pontiac Weather Forecast Office, accessed June 27, 2025. https://www.weather.gov/dtx/beechermet
- USACE, n.d.: Great Lakes Water Level Data. U.S. Army Corps of Engineers, Great Lakes and Ohio River Division, accessed June 27, 2025. https://www.lrd.usace.army.mil/Water-Information/Water-Management/Great-Lakes-and-Harbors/Water-Level-Data/
- USGCRP, 2017: Climate Science Special Report: Fourth National Climate Assessment, Volume I. Wuebbles, D.J., D.W. Fahey, K.A. Hibbard, D.J. Dokken, B.C. Stewart, and T.K. Maycock, Eds. U.S. Global Change Research Program, Washington, DC, USA, 470 pp. https://repository.library.noaa.gov/view/noaa/19486
- USGCRP, 2018: Impacts, Risks, and Adaptation in the United States: Fourth National Climate Assessment, Volume II. Reidmiller, D.R., C.W. Avery, D.R. Easterling, K.E. Kunkel, K.L.M. Lewis, T.K. Maycock, and B.C. Stewart, Eds. U.S. Global Change Research Program, Washington, DC, USA, 1515 pp. https://repository.library.noaa.gov/view/noaa/19487
- USGCRP, 2023: Fifth National Climate Assessment. Crimmins, A.R., C.W. Avery, D.R. Easterling, K.E. Kunkel, B.C. Stewart, and T.K. Maycock, Eds. U.S. Global Change Research Program, Washington, DC, USA. https://repository.library.noaa.gov/view/noaa/61592