PUERTO RICO AND THE U.S. VIRGIN ISLANDS
Puerto Rico and the U.S. Virgin Islands are located in the subtropical Caribbean region. Puerto Rico comprises the main island and several smaller nearby islands, including Vieques, Culebra, Isla de Mona, Caja de Muertos, and Isla Desecheo. The major islands of the U.S. Virgin Islands are St. Thomas, St. Croix, and St. John. Surrounded by ocean on all sides, the islands experience warm and humid tropical conditions with minimal temperature variations between seasons. The temperate climate of San Juan, Puerto Rico, illustrates the tropical conditions of these islands. The annual average (1991–2020 normals) temperature is 81.0°F. Temperatures are generally cooler in January, with an average minimum temperature of 72.0°F and an average maximum temperature of 83.2°F, and warmer in August, with an average minimum temperature of 77.8°F and an average maximum temperature of 89.1°F.
Figure 1

Precipitation across Puerto Rico and the U.S. Virgin Islands varies seasonally, with wetter summers and relatively drier winters. The predominant synoptic influence on the islands’ climate is the North Atlantic subtropical high, which causes prevailing trade winds predominantly from the east and northeast. The east to west positioning of the Cordillera Central, where the highest elevation is 4,390 feet, provides a natural divide that separates Puerto Rico into two climatologically distinct regions. The northern two-thirds of Puerto Rico has a mostly humid climate, and the southern portion has a drier, semiarid climate. The northeast trade winds provide water vapor for precipitation along the northern coast and outlying islands, but passage over this mountain range removes moisture through precipitation, and the resulting downslope flow is drier. The U.S. Virgin Islands are not as high in elevation (the highest point is 1,555 feet on St. Thomas), but topographic effects on precipitation still occur, with the west (upwind) sides being wetter than the east (downwind) sides.
The islands warmed throughout the 20th and early 21st centuries. For example, temperatures in Puerto Rico have risen almost 2°F since 1950 (Figure 1). The number of very hot days does not exhibit any trend (Figure 2). By contrast, extremely warm nights have generally been above average since 2000, with the highest number occurring since 2015 (Figure 3). The urban heat island effect has caused temperatures to rise faster in San Juan than across the rest of the islands. The surface temperatures of the surrounding ocean area, which provide an essential regulator on temperatures in Puerto Rico and the U.S. Virgin Islands, have risen by almost 2°F since the start of the 20th century (Figure 4).

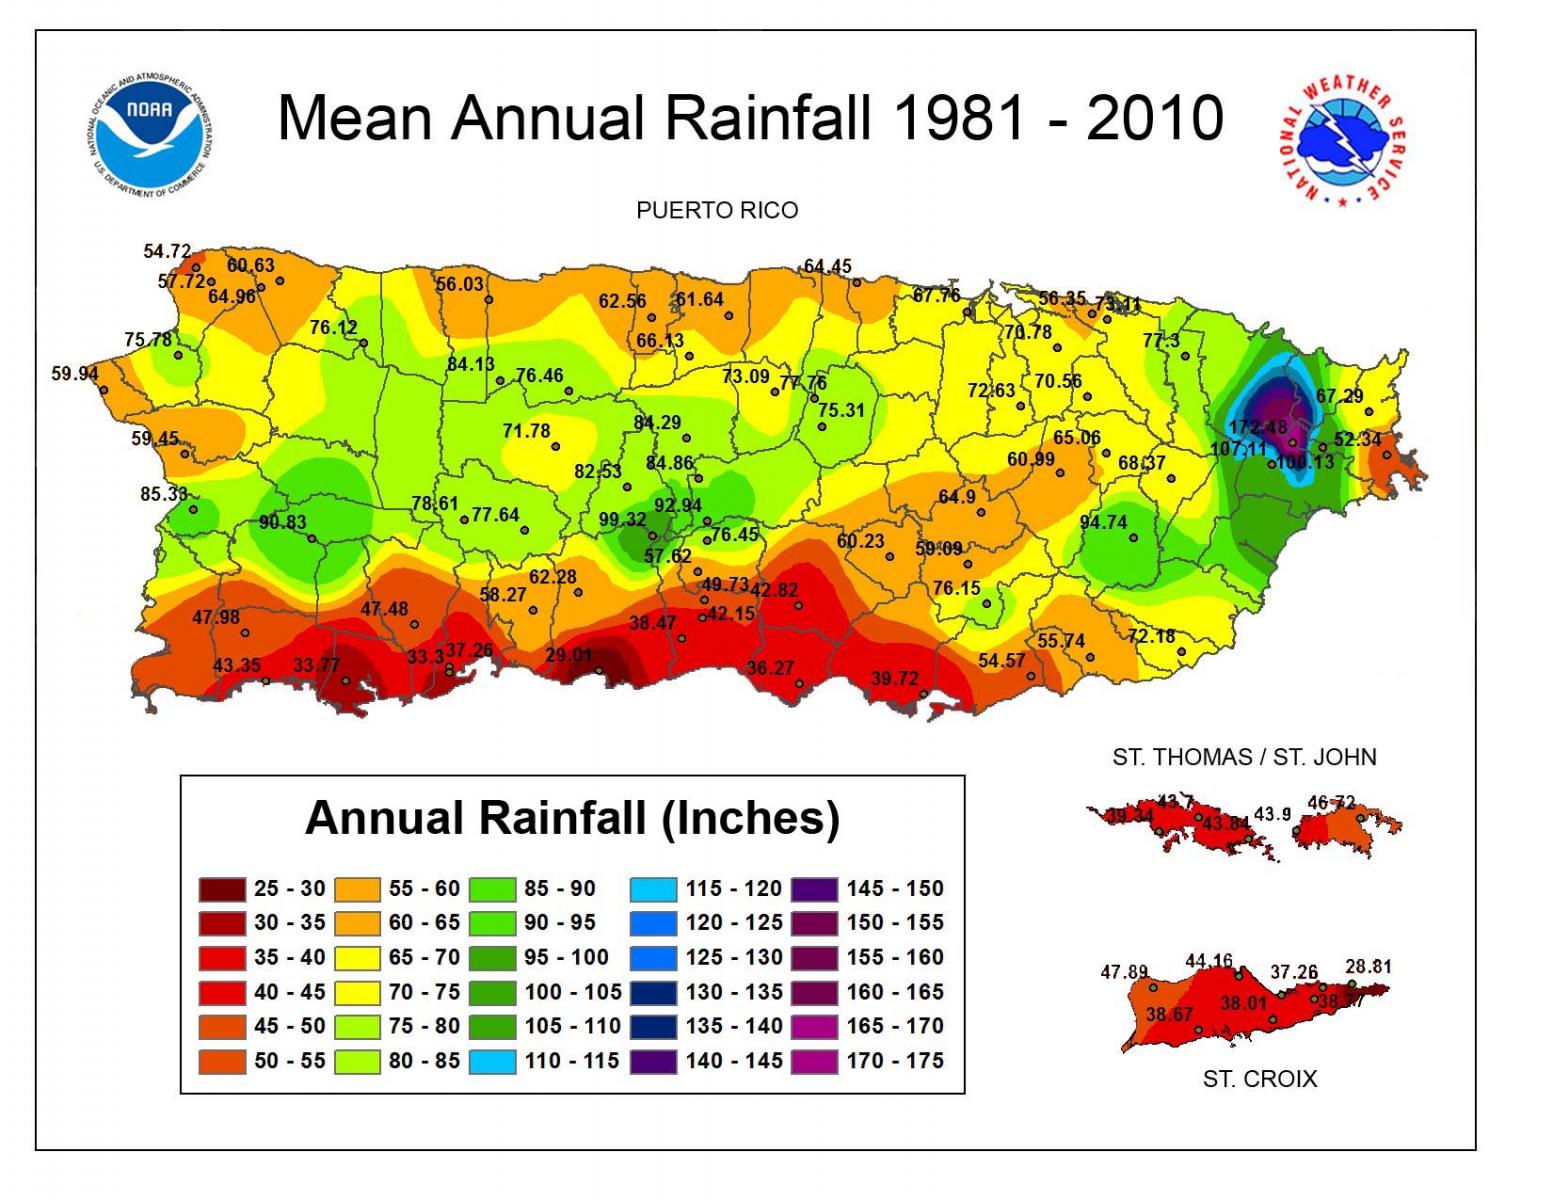
Annual precipitation for Puerto Rico ranges from more than 200 inches in the high elevation regions of the El Yunque National Forest (located in the Sierra de Luquillo mountains) in the northeastern part of the island to less than 40 inches at Ponce on the southern coast. Annual rainfall in the U.S. Virgin Islands is less than 60 inches across all the islands. Much of the rainfall in the wet season (May through October) derives from tropical cyclones (hurricanes and tropical storms) and easterly waves, which move from east to west, but high sea surface temperatures can also trigger local thunderstorm activity. In the dry season (November through April), rainfall is caused by cold fronts moving from west to east. Total annual precipitation in Puerto Rico varies from year to year but has been near to above average since 2003 (Figure 5).


Extreme precipitation in Puerto Rico has shown no overall trend since the 1950s. The highest number of 3-inch extreme precipitation events (Figure 6) occurred in the early 2010s. In 2011, Puerto Rico and the U.S. Virgin Islands experienced an extended period of heavy rainfall and flooding (not associated with a tropical cyclone) from mid-May through mid-June. Several locations recorded 2–4 times their normal rainfall during this period. Significant flooding occurred across Puerto Rico, with the exception of the southwest region of the island. Major flooding was also reported in Saint Croix, U.S. Virgin Islands, where weekly rainfall totals were on the order of 6 to 7 inches.
Tropical cyclone events (hurricanes, tropical storms, and tropical depressions) are an important concern for the islands due to their position in the Caribbean hurricane belt. While such weather systems occur near the islands only once every 1 to 2 years (Figure 7), they can have devastating impacts. The tropical cyclones that affected Puerto Rico and the U.S. Virgin Islands in this century include, but are not limited to, Tropical Storm Jeanne in 2004, Hurricane Irene (Category 1) in 2011, and Hurricane Irma (Category 5) in 2017. Hurricane Irene produced very heavy rainfall that resulted in major flooding in northeast Puerto Rico. In the late 20th century, Hurricane Hugo (Category 4) in 1989, Hurricane Marilyn (Category 2) in 1995, and Hurricane Georges (Category 3) in 1998 all caused catastrophic damage to the islands. Hurricane Lenny (Category 4) in 1999, the 2nd most powerful November hurricane of the satellite era, passed just to the south of the U.S. Virgin Islands while at peak intensity, causing more than $300 million in damages in Puerto Rico and the U.S. Virgin Islands; it was characterized by an unusual west to east track through the Caribbean. Earlier hurricanes of note are the San Felipe Segundo storm (Category 5) of 1928 and the San Ciprián storm (Category 4) of 1932. The two most devastating hurricanes occurred in 1899 and 2017. The 1899 San Ciriaco hurricane (Category 4), the most severe natural disaster recorded in the islands’ history, resulted in 3,300 deaths. In addition, a quarter of residents were left homeless, and more than $200 million in coffee production was destroyed. In September 2017, Hurricane Maria (Category 4) made landfall in Puerto Rico, causing devastating destruction across the islands. Winds that locally reached Category 5 intensity, combined with extremely heavy rainfall and the destructive power of wave action and storm surge, led to extensive damage to buildings and infrastructure. Severe flooding and mudslides affected much of Puerto Rico and the U.S. Virgin Islands, and most residents lost power for months in what is still the most severe power outage in American history. Maria is the third costliest hurricane in U.S. history, with an estimated $90 billion in total damages across the islands.

Under a higher emissions pathway, historically unprecedented warming is projected during this century (Figure 1). Even under a lower emissions pathway, annual average temperatures are projected to most likely exceed historical record levels by the middle of this century. However, a large range of temperature increases is projected under both pathways, and under the lower pathway, a few projections are only slightly warmer than historical records. Increases in the number of extremely hot days and warm nights are projected to accompany the overall warming.
A decrease in annual average precipitation in Puerto Rico and the U.S. Virgin Islands is projected over the 21st century (Figure 8). Model projections indicate a decrease in precipitation averaging around 10%, however, there is significant uncertainty in the magnitude of precipitation changes in the Southern Caribbean region. Puerto Rico and the U.S. Virgin Islands may face an increased risk of drought, potentially affecting water supplies, agriculture, and the economy.


Although overall precipitation is projected to decrease, extreme precipitation events are projected to increase due to increased water vapor available in response to climate change–related warming of ocean temperatures. While it is uncertain whether the total number of hurricanes will increase or decrease in the future, hurricane rainfall rates, storm surge heights due to sea level rise, and the number of major (Category 3, 4, and 5) hurricanes are all projected to increase.
Since 1962, the sea level at San Juan has risen by 0.7 inches per decade (equal to the global sea level rise rate). Sea level rise is an important concern due to Puerto Rico’s extensive coastline. Approximately 60% of the population lives within the islands’ 44 coastal cities, and these areas are also home to a significant share of the islands’ critical coastal infrastructure. Since 2010, sea level rise, as well as tropical cyclones and other extreme events, has increased the rate of erosion at many sites along the Puerto Rican coastline. By amplifying tidal and storm surge, even marginal amounts of sea level rise increase the likelihood of previously less common flooding events. Most of the U.S. Virgin Islands are well above sea level; however, waterfront property in the capital, Charlotte Amalie, is generally within a few feet of sea level.

Global sea level is projected to rise another 1–8 feet, with a likely range of 1–4 feet, by 2100 as a result of both past and future emissions from human activities (Figure 9), and similar rises are likely for Puerto Rico and the U.S. Virgin Islands. Some island-level estimates for Puerto Rico project a rise of up to 2.1 feet by 2060 and 4.9 feet by 2100 (Figure 10). Rising sea levels will likely result in increased coastal flooding, coastal erosion, and disruptions to coastal ecosystems and critical infrastructures.
Details on observations and projections are available on the Technical Details and Additional Information page.
RESOURCES
- Avila, L.A. and J. Cangialosi, 2011 (2013 update): Tropical Cyclone Report: Hurricane Irene, 21–28 August 2011. AL092011. National Oceanic and Atmospheric Administration, National Hurricane Center, Miami, FL, 45 pp. http://www.nhc.noaa.gov/data/tcr/AL092011_Irene.pdf
- Bush, D.M., R.M.T. Webb, J.G. Liboy, L. Hyman, and W.J. Neal, 1995: Living with the Puerto Rico Shore. Duke University Press Books, Durham, NC.
- EPA, 2016: What Climate Change Means for Puerto Rico. EPA 430-F-16-063. U.S. Environmental Protection Agency, Washington, DC, 2 pp. https://www.epa.gov/sites/default/files/2016-09/documents/climate-change-pr.pdf
- EPA, 2016: What Climate Change Means for the U.S. Virgin Islands. EPA 430-F-16—65. U.S. Environmental Protection Agency, Washington, DC, 2 pp. https://www.epa.gov/sites/default/files/2016-11/documents/climate-change-usvi.pdf
- Gould, W.A., E.L. Díaz, (co-leads), N.L. Álvarez-Berríos, F. Aponte-González, W. Archibald, J.H. Bowden, L. Carrubba, W. Crespo, S.J. Fain, G. González, A. Goulbourne, E. Harmsen, E. Holupchinski, A.H. Khalyani, J. Kossin, A.J. Leinberger, V.I. Marrero-Santiago, O. Martínez-Sánchez, K. McGinley, P. Méndez-Lázaro, J. Morell, M.M. Oyola, I.K. Parés-Ramos, R. Pulwarty, W.V. Sweet, A. Terando, and S. Torres-González, 2018: U.S. Caribbean. In: Impacts, Risks, and Adaptation in the United States: Fourth National Climate Assessment, Volume II. Reidmiller, D.R., C.W. Avery, D. Easterling, K. Kunkel, K.L.M. Lewis, T.K. Maycock, and B.C. Stewart, Eds. U.S. Global Change Research Program, Washington, DC, USA, 809–871. http://dx.doi.org/10.7930/NCA4.2018.CH20
- Hayhoe, K., D.J. Wuebbles, D.R. Easterling, D.W. Fahey, S. Doherty, J. Kossin, W. Sweet, R. Vose, and M. Wehner, 2018: Our changing climate. In: Impacts, Risks, and Adaptation in the United States: Fourth National Climate Assessment, Volume II. Reidmiller, D.R., C.W. Avery, D.R. Easterling, K.E. Kunkel, K.L.M. Lewis, T.K. Maycock, and B.C. Stewart, Eds. U.S. Global Change Research Program, Washington, DC, 72–144. https://nca2018.globalchange.gov/chapter/2/
- Jury, M.R., S. Chiao, and E.W. Harmsen, 2009: Mesoscale structure of trade wind convection over Puerto Rico: Composite observations and numerical simulation. Boundary-Layer Meteorology, 132 (2), 289–313. http://dx.doi.org/10.1007/s10546-009-9393-3
- Jury, M.R., R. Rios-Berrios, and E. García, 2012: Caribbean hurricanes: Changes of intensity and track prediction. Theoretical and Applied Climatology, 107 (1), 297–311. http://dx.doi.org/10.1007/s00704-011-0461-5
- Knutson, T.R., J.L. McBride, J. Chan, K. Emanuel, G. Holland, C. Landsea, I. Held, J.P. Kossin, A.K. Srivastava, and M. Sugi, 2010: Tropical cyclones and climate change. Nature Geoscience, 3 (3), 157–163. http://dx.doi.org/10.1038/ngeo779
- Kunkel, K.E., P.D. Bromirski, H.E. Brooks, T. Cavazos, A.V. Douglas, D.R. Easterling, K.A. Emanuel, P.Y. Groisman, G.J. Holland, T.R. Knutson, J.P. Kossin, P.D. Komar, D.H. Levinson, and R.L. Smith, 2008: Observed Changes in Weather and Climate Extremes. In: Weather and Climate Extremes in a Changing Climate. Regions of Focus: North America, Hawaii, Caribbean, and U.S. Pacific Islands. Karl, T.R., G.A. Meehl, C.D. Miller, S.J. Hassol, A.M. Waple, and W.L. Murray, Eds. Climate Change Science Program, Washington, DC, 35–80. https://downloads.globalchange.gov/sap/sap3-3/sap3-3-final-all.pdf
- Kunkel, K.E., L.E. Stevens, S.E. Stevens, L. Sun, E. Janssen, D. Wuebbles, C.E.K. II, C.M. Fuhrman, B.D. Keim, M.C. Kruk, A. Billet, H. Needham, M. Schafer, and J.G. Dobson, 2013: Regional Climate Trends and Scenarios for the U.S. National Climate Assessment Part 2. Climate of the Southeast. U.S. NOAA Technical Report NESDIS 142-2. National Oceanic and Atmospheric Administration, National Environmental Satellite, Data, and Information Service, Silver Spring, MD, 95 pp. https://nesdis-prod.s3.amazonaws.com/migrated/NOAA_NESDIS_Tech_Report_142-2-Climate_of_the_Southeast_US.pdf
- Melillo, J.M., T.C. Richmond, and G.W. Yohe, 2014: Climate Change Impacts in the United States: The Third National Climate Assessment. Washington, DC, 841 pp. http://dx.doi.org/10.7930/J0Z31WJ2
- Méndez-Lázaro, P., O. Martínez-Sánchez, R. Méndez-Tejeda, E. Rodríguez, E. Morales, and N. Schmitt-Cortizo, 2015: Extreme heat events in San Juan Puerto Rico: Trends and variability of unusual hot weather and its possible effects on ecology and society. Journal of Climatology & Weather Forecasting, 3 (2). http://dx.doi.org/10.4172/2332-2594.1000135
- NOAA NCEI, n.d.: U.S. Climate Normals [30-Year Normals 1991–2020]. National Oceanic and Atmospheric Administration, National Centers for Environmental Information, Asheville, NC. https://www.ncei.noaa.gov/products/us-climate-normals
- NOAA NHC, n.d.: Historical Hurricane Tracks. National Oceanic and Atmospheric Administration, National Hurricane Center, Miami, FL. https://coast.noaa.gov/hurricanes/#map=4/32/-80
- NOAA NHC and CPHC, n.d.: 2016 Atlantic Hurricane Season. National Oceanic and Atmospheric Administration, National Hurricane Center and Central Pacific Hurricane Center, Miami, FL, and Honolulu, HI. https://www.nhc.noaa.gov/data/tcr/index.php?season=2016&basin=atl
- NOAA NHC and CPHC, n.d.: 2017 Atlantic Hurricane Season. National Oceanic and Atmospheric Administration, National Hurricane Center and Central Pacific Hurricane Center, Miami, FL, and Honolulu, Hi. https://www.nhc.noaa.gov/data/tcr/index.php?season=2017&basin=atl
- NOAA NWS, n.d.: Extended Period of Heavy Rain and Flooding in Puerto Rico and the U.S. Virgin Islands May 12–June 16, 2011. National Oceanic and Atmospheric Administration, National Weather Service, Silver Spring, MD, 11 pp. https://www.weather.gov/media/sju/hydrology/flood_May12_Jun16.pdf
- NOAA NWS, n.d.: Mean Annual Rainfall 1981–2010 (Puerto Rico and the U.S. Virgin Islands). National Oceanic and Atmospheric Administration, National Weather Service, Silver Spring, MD. https://www.weather.gov/images/sju/hydrology/2010_ncdc_precip_normals_PR_USVI.jpg
- Parris, A., P. Bromirski, V. Burkett, D. Cayan, M. Culver, J. Hall, R. Horton, K. Knuuti, R. Moss, J. Obeysekera, A. Sallenger, and J. Weiss, 2012: Global Sea Level Rise Scenarios for the United States National Climate Assessment. NOAA Technical Report OAR CPO-1. National Oceanic and Atmospheric Administration, Office of Oceanic and Atmospheric Research, Climate Program Office, Silver Spring, MD, 33 pp. https://repository.library.noaa.gov/view/noaa/11124
- Pasch, R.J., A.B. Penny, and R. Berg, 2019: Tropical Cyclone Report: Hurricane Maria 16–30 September 2017. AL152017. National Oceanic and Atmospheric Administration, National Hurricane Center, Miami, FL, 48 pp. https://www.nhc.noaa.gov/data/tcr/AL152017_Maria.pdf
- Puerto Rico Climate Change Council, 2013: Puerto Rico’s State of the Climate 2010–2013: Assessing Puerto Rico’s Social-Ecological Vulnerabilities in a Changing Climate. Puerto Rico Coastal Zone Management Program, Department of Natural and Environmental Resources, NOAA Office of Ocean and Coastal Resource Management, San Juan, PR, 328 pp. http://pr-ccc.org/download/PR%20State%20of%20the%20Climate-FINAL_ENE2015.pdf
- Sweet, W.V., R. Horton, R.E. Kopp, A.N. LeGrande, and A. Romanou, 2017: Sea level rise. In: Climate Science Special Report: Fourth National Climate Assessment, Volume I. Wuebbles, D.J., D.W. Fahey, K.A. Hibbard, D.J. Dokken, B.C. Stewart, and T.K. Maycock, Eds. U.S. Global Change Research Program, Washington, DC, 333–363. http://dx.doi.org/10.7930/J0VM49F2
- Sweet, W.V., R.E. Kopp, C.P. Weaver, J. Obeysekera, R.M. Horton, E.R. Thieler, and C. Zervas, 2017: Global and Regional Sea Level Rise Scenarios for the United States. NOAA Technical Report NOS CO-OPS 083. National Oceanic and Atmospheric Administration, National Ocean Service, Center for Operational Oceanographic Products and Services, Silver Spring, MD, 75 pp. https://tidesandcurrents.noaa.gov/publications/techrpt83_Global_and_Regional_SLR_Scenarios_for_the_US_final.pdf
- USGS CFWSC, n.d.: Climate of Puerto Rico. U.S. Geological Survey, Caribbean–Florida Water Science Center, Lutz, FL. https://www.usgs.gov/centers/car-fl-water/science/climate-puerto-rico?qt-science_center_objects=0#qt-science_center_objects
- Velazquez-Lozada, A., J.E. Gonzalez, and A. Winter, 2006: Urban heat island effect analysis for San Juan, Puerto Rico. Atmospheric Environment, 40 (9), 1731–1741. http://dx.doi.org/10.1016/j.atmosenv.2005.09.074
- Vose, R.S., D.R. Easterling, K.E. Kunkel, A.N. LeGrande, and M.F. Wehner, 2017: Temperature changes in the United States. In: Climate Science Special Report: Fourth National Climate Assessment, Volume I. Wuebbles, D.J., D.W. Fahey, K.A. Hibbard, D.J. Dokken, B.C. Stewart, and T.K. Maycock, Eds. U.S. Global Change Research Program, Washington, DC, 185–206. http://doi.org/10.7930/J0N29V45