Utah is a geographically diverse state with forested, mountainous, and desert regions. It has a varied climate due to its inland continental location and a wide range of topography. Elevations across the state range from approximately 2,500 feet in the Virgin River Valley to 13,500 feet in the Uinta Mountains. Typical summer high temperatures range from less than 70°F at high elevations to almost 100°F in the far southwestern corner of the state (1991–2020 averages). Average winter low temperatures are below freezing throughout the state, ranging from less than 10°F in some mountainous areas to almost 30°F in southern desert regions. In the northern part of the state, the Great Salt Lake has a moderating effect on local temperatures. Utah has a largely arid to semiarid climate and is prone to frequent drought conditions due to low annual precipitation amounts and relatively high water consumption. Most of Utah is relatively dry, in part because the Sierra Nevada block moisture from the Pacific Ocean. In the northwestern part of the state, most precipitation falls during the winter and spring months, while thunderstorms fueled by moisture from the North American Monsoon provide summer precipitation in the east and south. However, precipitation is highly variable across the state, with annual totals ranging from less than 5 inches in portions of the Great Salt Lake Desert to more than 40 inches in some portions of the Wasatch Mountains.

Time series of observed and projected temperature change (in degrees Fahrenheit) for Utah from 1900 to 2100 as described in the caption.
Y-axis values range from negative 4 to positive 20 degrees. Observed annual temperatures from 1900 to 2024 show variability and range from negative 2.1 to positive 4.0 degrees. By the end of the century, projected increases in temperature range from 2.0 to 7.9 degrees under the lower emissions pathway, from 4.6 to 11.5 degrees under the intermediate pathway, and from 9.2 to 18.6 degrees under the higher pathway.
Annual average temperatures in Utah have increased about 3°F since the beginning of the 20th century (Figure 1), and 2015–2024 was the warmest decade on record. The hottest year on record for Utah was 1934, with an annual average temperature of 51.3°F, followed by 2024 with an average of 51.1°F. The number of extremely hot days has generally been above average since the late 1980s (Figure 2a). In keeping with the overall trend of higher temperatures, the state has generally experienced an above-average number of very warm nights and a below-average number of very cold nights since the 1990s (Figures 2b and 3).

Graph of the observed annual number of (a) extremely hot days and (b) very warm nights for Utah from 1900 to 2024 as described in the caption.
Panel A: Extremely Hot Days
Y-axis values range from 0 to 28 days. Annual values show year-to-year variability and range from 0.3 to 24.6 days. Five-year values also show variability and are mostly near or below the long-term average of 11.3 days between 1900 and 1984 but are all near or above average since 1985. The 1915 to 1919 period has the lowest 5-year value at 5.1 days, and the 2000 to 2004 and 2020 to 2024 periods have the highest at 18.2 and 18.9 days, respectively.
Panel B: Very Warm NightsY-axis values range from 0 to 10 nights. Annual values show variability and range from 0 to 8.4 nights. Five-year values also show variability and are all near or below the long-term average of 1.8 nights between 1900 and 1989 but are all above average since 1990. The 1900 to 1904 period has the lowest 5-year value at 0.1 nights, and the 2000 to 2004 and 2020 to 2024 periods have the highest at 5.3 and 4.9 nights, respectively.

Graph of the observed annual number of very cold nights for Utah from 1900 to 2024 as described in the caption.
Y-axis values range from 0 to 28 nights. Annual values show variability and range from 0.7 to 23.8 nights. Five-year values also show variability and are mostly near or above the long-term average of 7.1 nights between 1900 and 1989 but are all below average since 1990. The 1995 to 1999 and 2020 to 2024 periods have the lowest 5-year value at 2.9 nights each, and the 1930 to 1934 period has the highest at 12.8 nights.
Statewide total annual precipitation has ranged from a low of 7.2 inches in 2020 to a high of 20.3 inches in 1941 (Figure 4). Unlike many areas of the United States, Utah and other southwestern states have not experienced an upward trend in the frequency of extreme precipitation events (Figure 5).
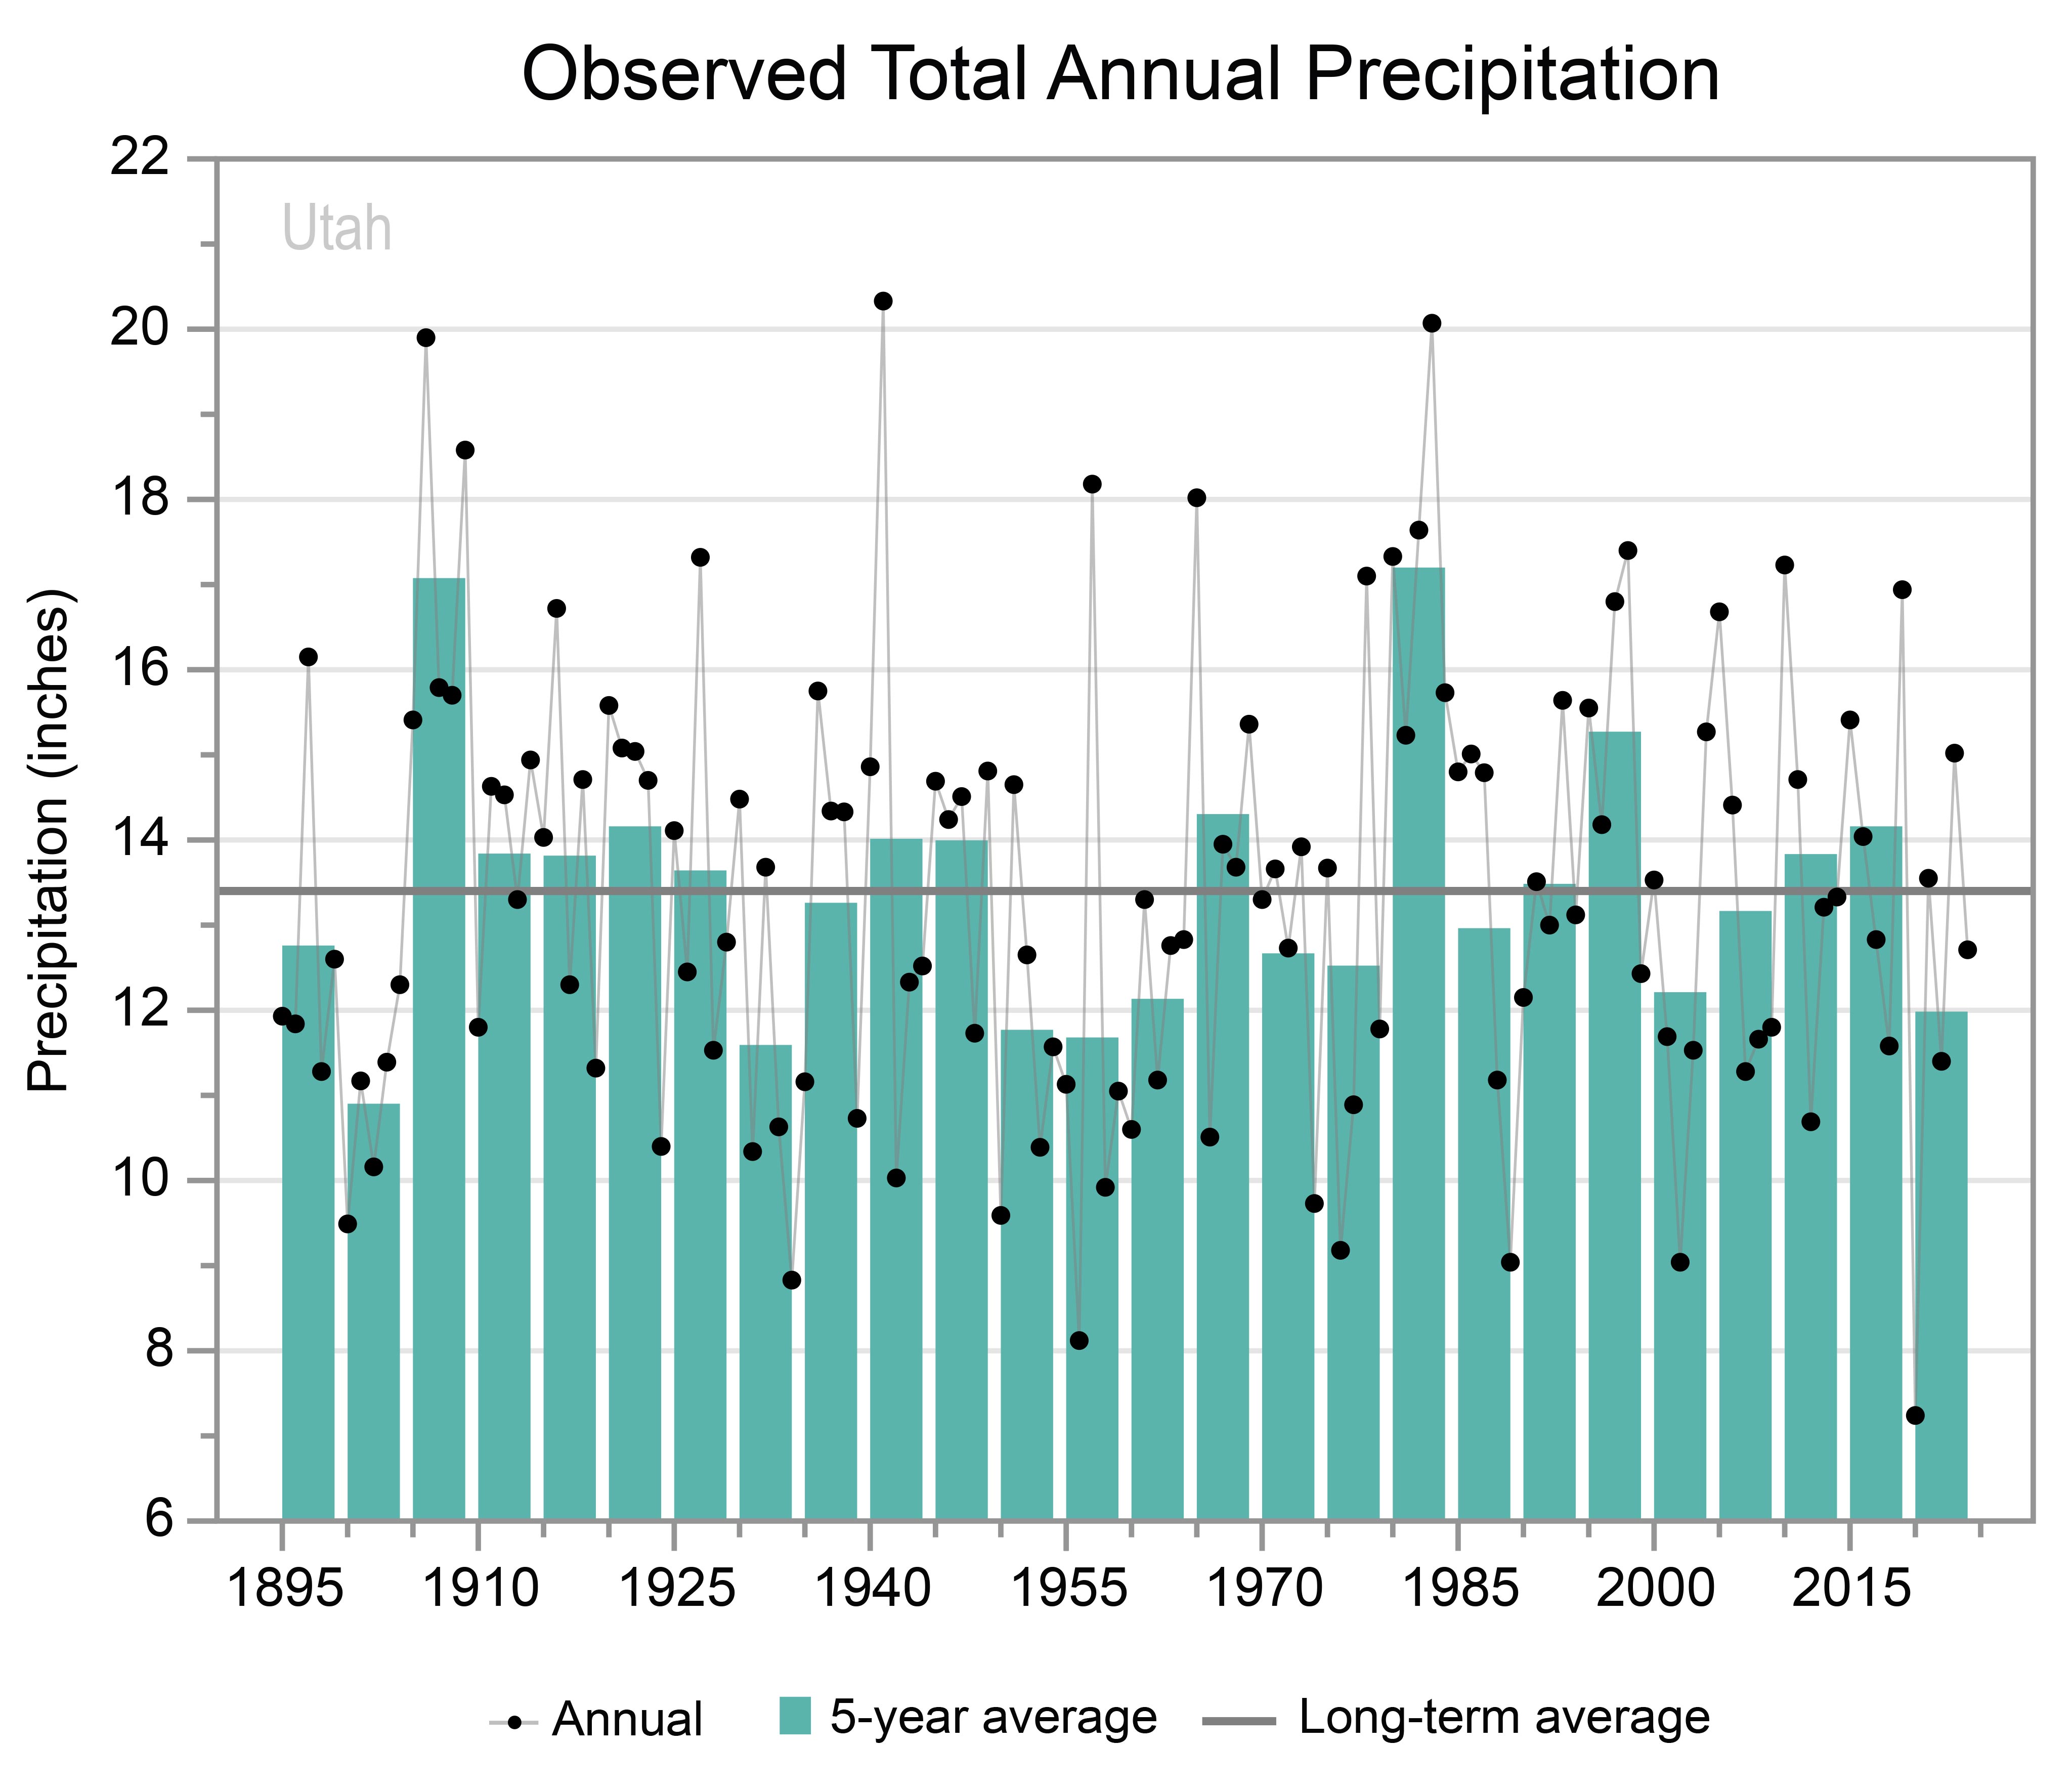
Graph of the observed total annual precipitation for Utah from 1895 to 2024 as described in the caption.
Y-axis values range from 6 to 22 inches. Annual values show variability and range from 7.2 to 20.3 inches. Five-year values also show variability and are below the long-term average of 13.4 inches between 1895 and 1904 but are all near or above average between 1905 and 1949 except for the 1930 to 1934 and 1935 to 1939 periods. Since 1950, 5-year values are mostly below average. One notable exception is the 1980 to 1984 period, which has the highest 5-year value at 17.2 inches; the 1905 to 1909 period has the second-highest 5-year value at 17.1 inches. The 1900 to 1904 period has the lowest 5-year value at 10.9 inches.

Graph of the observed annual number of 1-inch extreme precipitation events for Utah from 1900 to 2024 as described in the caption.
Y-axis values range from 0 to 4 events. Annual values show variability and range from 0.1 to 3.5 events. Five-year values also show variability and are all near or above the long-term average of 1.1 events between 1900 and 1939 except for the 1930 to 1934 period. Since 1940, 5-year values are mostly below average. The 1960 to 1964 period has the lowest 5-year value at 0.5 events, and the 1905 to 1909 period has the highest at 2.7 events.
Snowfall varies widely across the state, with portions of the south receiving little or no snow and areas in the mountains receiving hundreds of inches per year. In 2022–23, Utah saw its snowiest winter season, with several ski resorts in the state reporting more than 700 inches and with a record-high snow water equivalent (the amount of water contained within the snowpack) recorded at Ben Lomond Peak (Figure 6). The area around the Great Salt Lake can receive significant snowfall due to lake-effect snow events. The lake’s high salt content prevents it from freezing, and the open waters can efficiently warm and moisten cold air masses as they pass over the lake, occasionally triggering bands of heavy snowfall over areas to the east and south of the lake. As the state has warmed, the proportion of precipitation falling as snow during the winter has decreased, as have snow depth and snow cover.

Time series of the annual variations in the April 1 snow water equivalent at Ben Lomond Peak, Utah, from 1979 to 2024 as described in the caption.
Y-axis values range from 0 to 90 inches. Annual values show year-to-year variability and range from 10.1 inches in 2015 to 79.9 inches in 2023. Between 1979 and the early 1980s, annual values are mostly between 40 and 60 inches; between the mid-1980s and the late 2010s, they are mostly between 20 and 50 inches; and since the early 2020s, they range from less than 20 inches to nearly 80 inches.
Flooding resulting from heavy rainfall and snowmelt can have devastating impacts. In 1983, melting of a large snowpack during April and June caused mudslides and extensive flooding in the Salt Lake Valley. In January 2005, heavy rains in the Virgin River Basin caused severe flooding along the Virgin and Santa Clara Rivers in Washington County, resulting in more than $225 million in damages.
Utah frequently experiences droughts, which can have critical impacts on water supplies. The historical record indicates periodic prolonged wet and dry periods (Figure 7). Since snowmelt provides water for many river basins, abnormally low winter precipitation and spring precipitation often trigger drought conditions, as less water is contained within the snowpack. In 2012, Utah experienced one of its driest springs, resulting in severe drought conditions (as defined by the US Drought Monitor) in areas across the entire state. The year 2020—the driest year on record—ended with 90% of the state in extreme or exceptional drought—the two highest categories of drought severity. These conditions persisted throughout much of Utah in 2021 and 2022 as well. Drought also exacerbates wildfire risk. The Milford Flat Fire, a lightning-sparked blaze, burned 363,000 acres in Millard and Beaver Counties in 2007—a year when more than 600,000 acres burned statewide. The state also saw active fire seasons in 2012 (more than 410,000 acres burned), 2018 (more than 400,000 acres), and 2020 (more than 300,000 acres). Persistent dry conditions since 2000 reduced water levels in the Great Salt Lake to a record low in November 2022, although they have rebounded somewhat since then (Figure 8). Low lake levels are harmful to ecosystems as well as public health: winds blowing across the dry lake bed can pick up dust containing heavy metals and other harmful substances, reducing air quality in nearby urban areas.

Line graph of the Utah Palmer Drought Severity Index for the years 1000 to 2024 as described in the caption.
Y-axis values are divided into dry and wet categories, ranging from 0 to negative 8 (dry) and 0 to positive 8 (wet). Annual values range from negative 7.8 to positive 6.2. Annual values for most years fall between negative 3 and positive 2, but values reaching negative 4 and positive 3 are common. The 20-year running average also shows variability, with values ranging from negative 2.2 to positive 2.3. Since the beginning of the modern era (red line), the running average is generally high in the positive range until the 1920s, then drops below 0 until the 1970s, when it rises again into the positive range. Since the 1990s, the running average shows a decline, reaching a low of negative 1.1 in 2014.
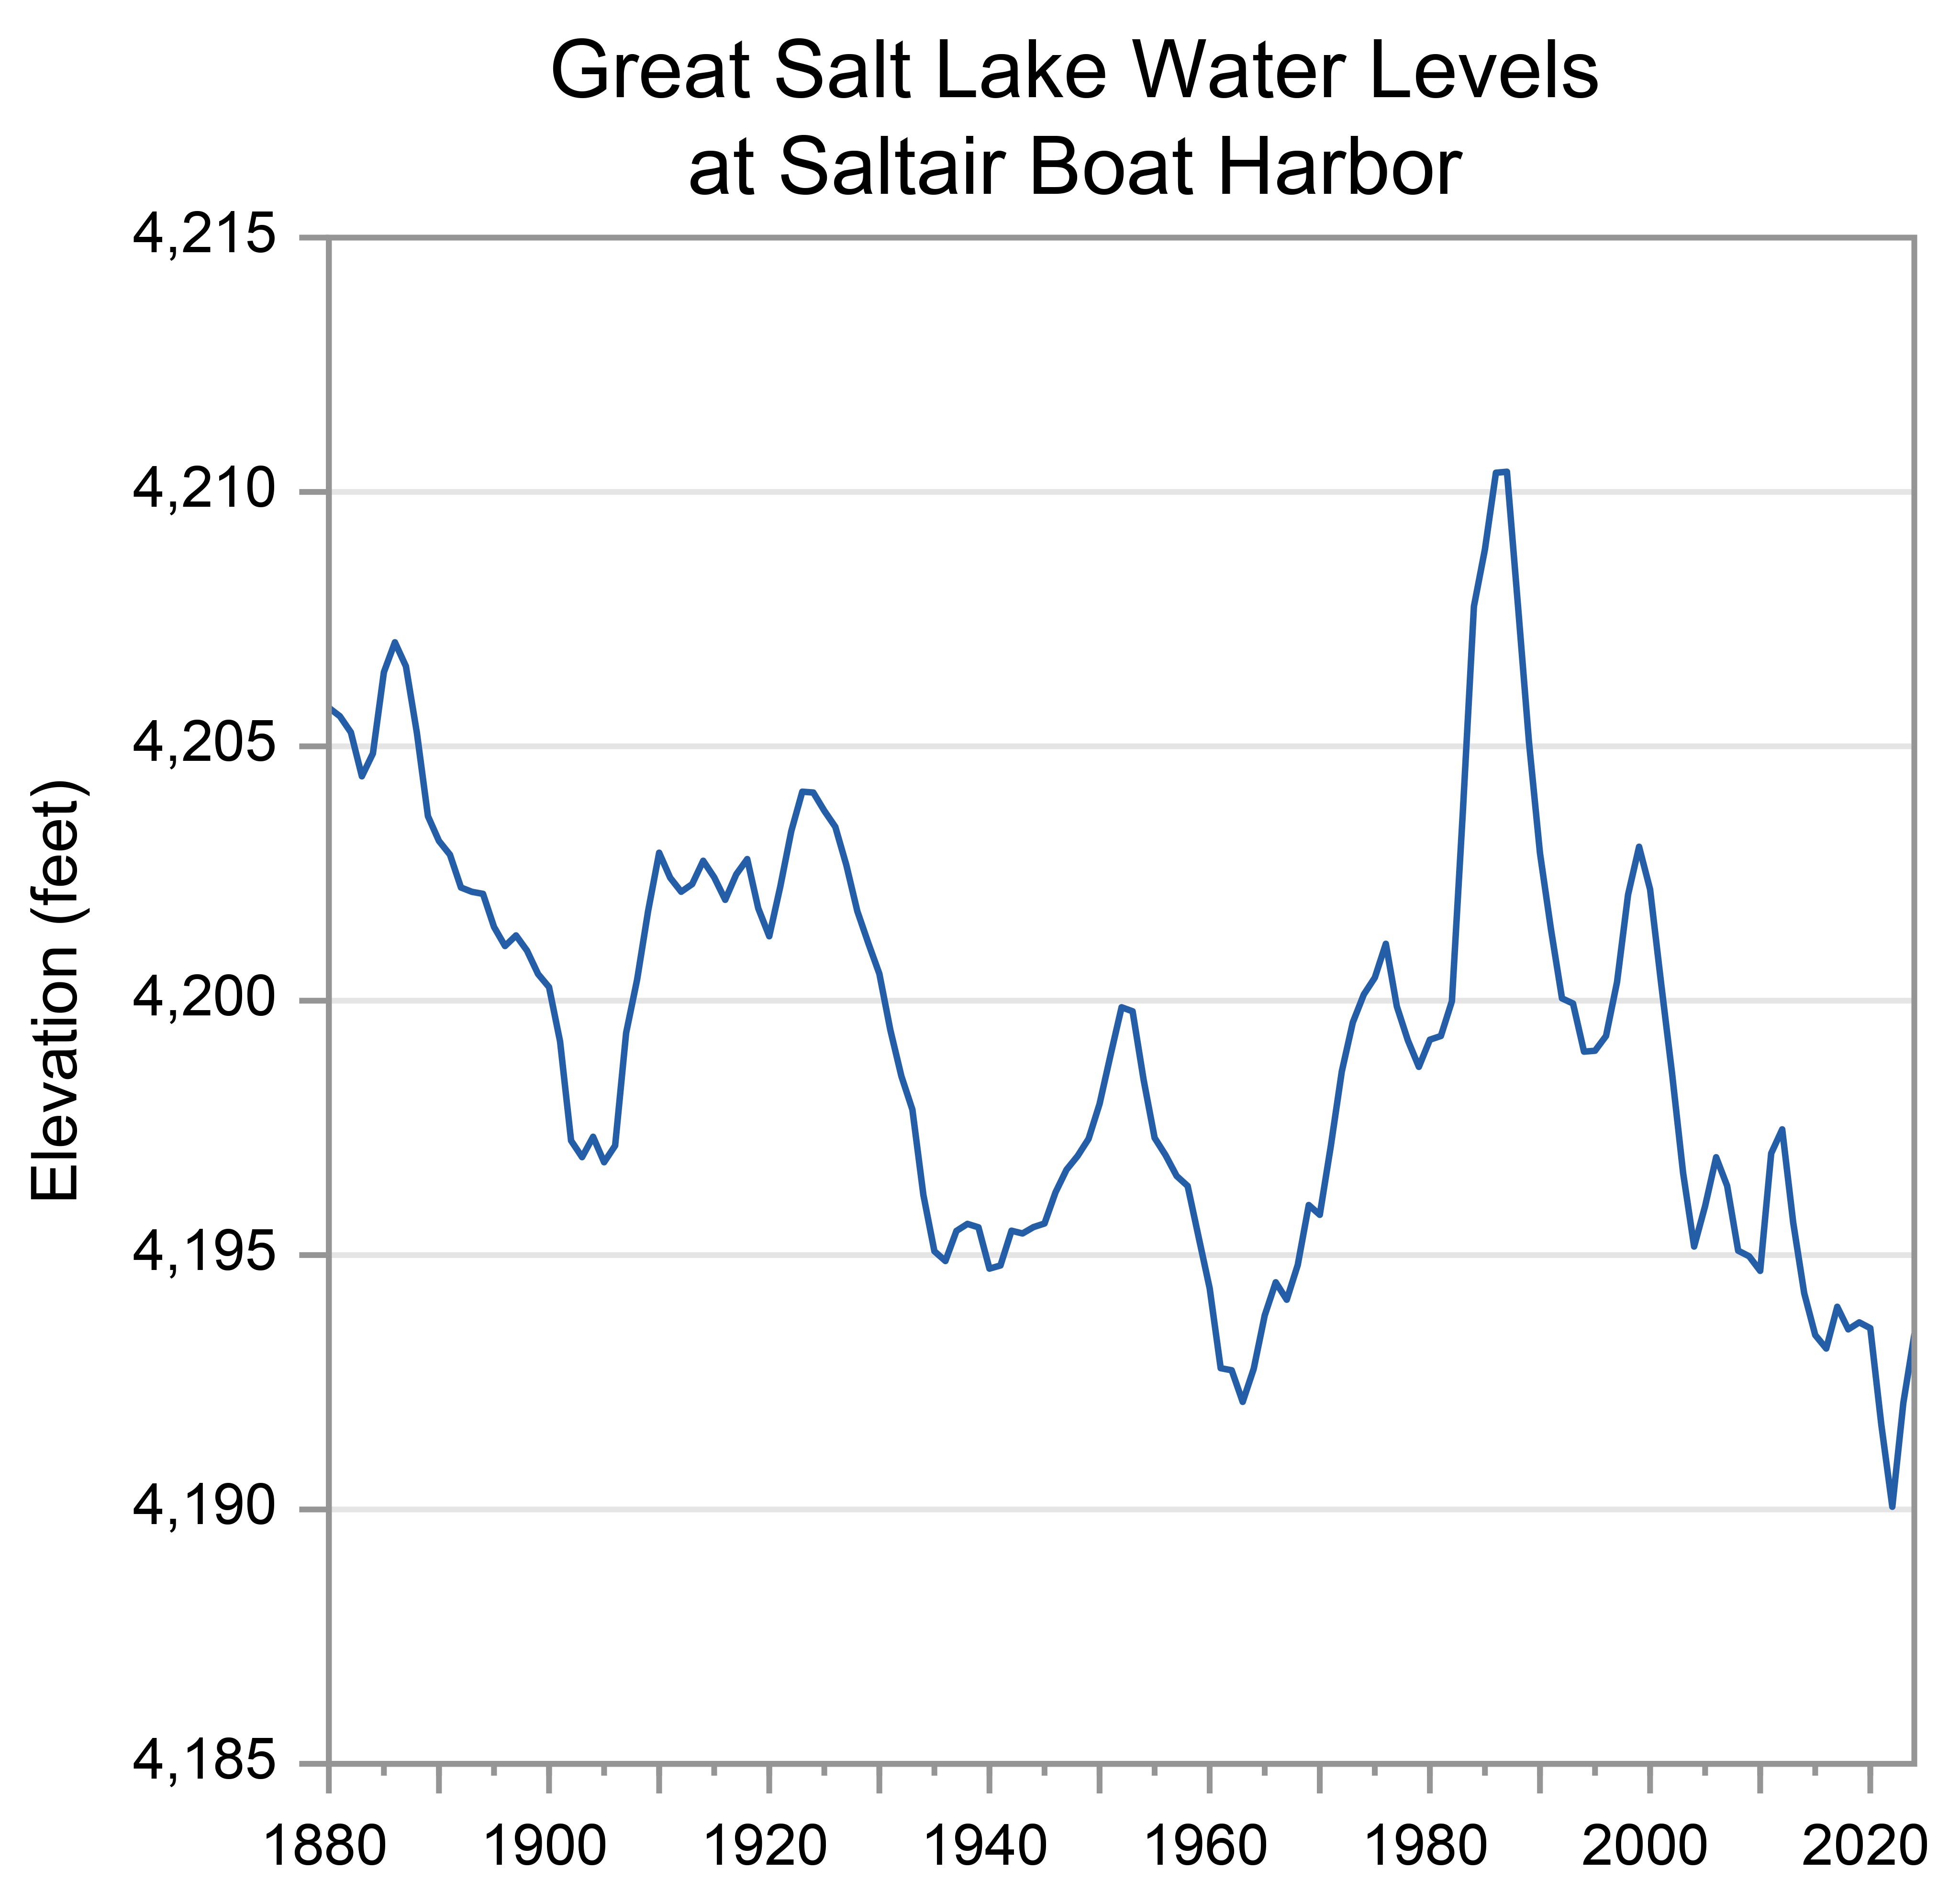
Time series of annual average water levels in the Great Salt Lake at Saltair Boat Harbor, Utah, from 1880 to 2024 as described in the caption.
Y-axis values range from 4,185 to 4,215 feet. Annual values show year-to-year variability and range from a low of 4,190.1 feet in 2022 to a high of 4,210.4 feet in 1987. Water levels drop gradually between 1880 and the early 1960s, from about 4,207 to 4,192 feet, then rise rapidly between the mid-1960s to the late 1980s from about 4,194 to 4,210 feet. Between the early 1990s and early 2020s, levels drop steadily to about 4,190 feet, with a slight increase of about 3 feet between 2022 and 2024.
Under the intermediate and higher emissions pathways, historically unprecedented warming is projected during this century (Figure 1). Even under the lower emissions pathway, most projections show annual average temperatures exceeding historical levels by the middle of this century. However, projections for all three pathways show a large range of potential temperature increases, and some projections for the lower pathway are comparable to recent observed values. Heat wave intensity is expected to increase, while cold wave intensity is expected to decrease.
Under the intermediate emissions pathway, projections indicate increases in total annual precipitation by midcentury across Utah; however, the projected changes are not statistically significant (Figure 9). There is similar uncertainty in projections for seasonal precipitation, although models generally indicate statewide increases in fall and winter precipitation and both increases and decreases in spring and summer. Extreme precipitation events are projected to become more frequent and intense, potentially increasing flood risks.
Rising temperatures are expected to raise the snow line (the average lowest elevation at which snow falls) and, continuing recent trends, increase the likelihood that precipitation falls as rain rather than snow. As a result, water storage in the snowpack is expected to decrease, particularly at those lower mountain elevations that are currently on the margins of reliable snowpack accumulation. Higher spring temperatures are also expected to result in earlier melting of the snowpack, further decreasing water availability during the already-dry summer months.
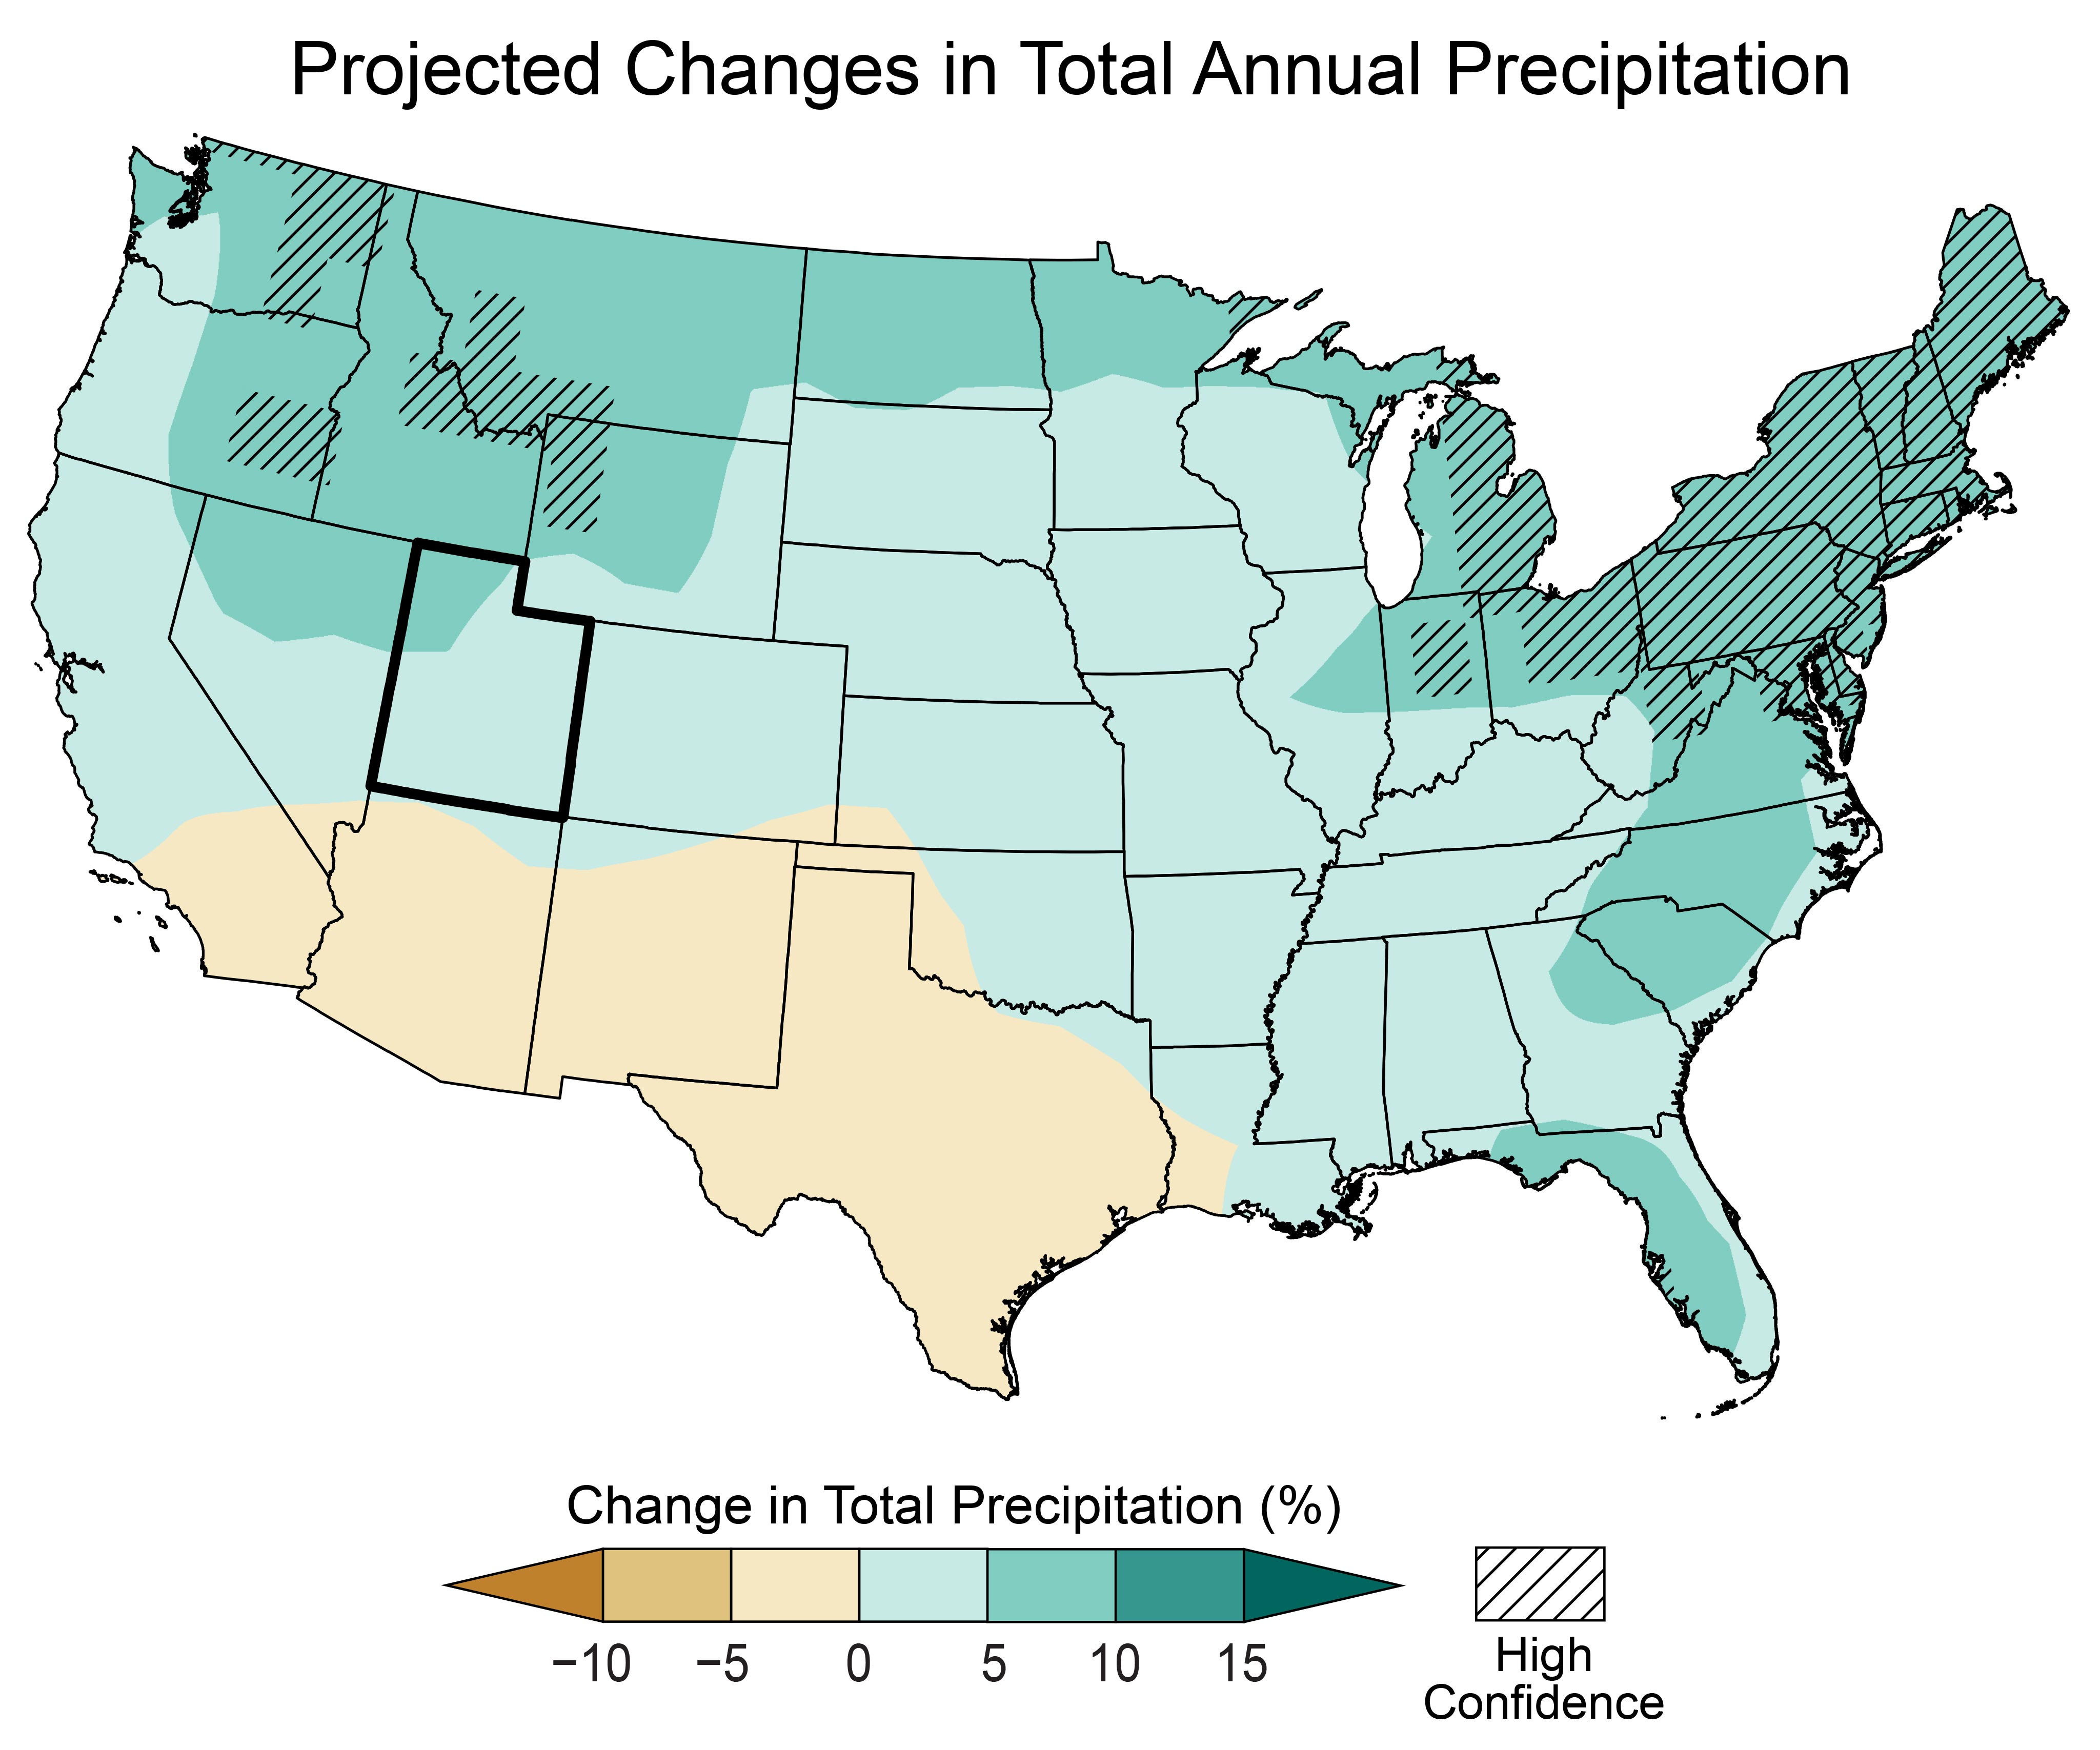
Map of the contiguous United States showing the projected changes in total annual precipitation by the middle of this century as described in the caption. The state of Utah is outlined in black.
Legend values range from less than negative 10 to greater than positive 15 percent. Note: unless otherwise specified, projected values are not statistically significant.
Utah
The entire state of Utah is projected to see increases in total annual precipitation of up to 10 percent.
Contiguous US
Projected increases in total annual precipitation are as follows: up to 5 percent for most of the Southeast, as well as the central Midwest, central Great Plains, central West, and Northwest; and 5 to 10 percent for all of the Northeast, as well as portions of the Mid-Atlantic, Southeast, northern Midwest, northern Great Plains, and Pacific Northwest, with statistically significant increases in the 5 to 10 percent range for the Northeast, northeastern Midwest, and portions of the northern Great Plains and Pacific Northwest.
Projected decreases of up to 5 percent are expected across most of Texas, New Mexico, and Arizona, as well as southern California.
Rising temperatures are expected to make naturally occurring dry spells more severe by increasing evaporation rates and soil moisture loss. Increases in the intensity of naturally occurring droughts are expected to increase both the frequency and intensity of wildfires.
SOURCES
- Gillies, R.R., S.-Y. Wang, and M.R. Booth, 2012: Observational and synoptic analyses of the winter precipitation regime change over Utah. Journal of Climate, 25 (13), 4679–4698. https://doi.org/10.1175/jcli-d-11-00084.1
- Great Salt Lake Strike Team, 2025: Great Salt Lake Data and Insights Summary: A synthesized resource document for the 2025 General Legislative Session. The University of Utah, Kem C. Gardner Policy Institute, 28 pp. https://d36oiwf74r1rap.cloudfront.net/wp-content/uploads/2025/01/GSL-Jan2025.pdf
- Kunkel, K.E., L.E. Stevens, S.E. Stevens, L. Sun, E. Janssen, D. Wuebbles, K.T. Redmond, and J.G. Dobson, 2013: Regional Climate Trends and Scenarios for the U.S. National Climate Assessment Part 5. Climate of the Southwest U.S. NOAA Technical Report NESDIS 142-5. National Oceanic and Atmospheric Administration, National Environmental Satellite, Data, and Information Service, Washington, DC, 87 pp. https://repository.library.noaa.gov/view/noaa/56810
- MRCC, n.d.: cli-MATE: MRCC Application Tools Environment. Midwestern Regional Climate Center, accessed November 6, 2025. https://mrcc.purdue.edu/newclimate
- NCDC, n.d.: Climate of Utah. National Oceanic and Atmospheric Administration, National Climatic Data Center, Asheville, NC, 4 pp. https://www.ncei.noaa.gov/data/climate-normals-deprecated/access/clim60/states/Clim_UT_01.pdf
- NCEI, n.d.: Climate at a Glance. National Oceanic and Atmospheric Administration, National Centers for Environmental Information, accessed November 6, 2025. https://www.ncei.noaa.gov/access/monitoring/climate-at-a-glance/
- NCEI, n.d.: Drought Variability [Data Access: Palmer Drought Index Studies: North American Drought Atlas (NADA) (Version 2a)]. National Oceanic and Atmospheric Administration, National Centers for Environmental Information, accessed November 6, 2025. https://www.ncei.noaa.gov/products/paleoclimatology/drought-variability
- NCEI, n.d.: National Climate Report. National Oceanic and Atmospheric Administration, National Centers for Environmental Information, accessed November 6, 2025. https://www.ncei.noaa.gov/access/monitoring/monthly-report/national
- NCEI, n.d.: U.S. Climate Normals. National Oceanic and Atmospheric Administration, National Centers for Environmental Information, accessed November 6, 2025. https://www.ncei.noaa.gov/products/land-based-station/us-climate-normals
- NIDIS, n.d.: National Conditions: Utah. National Oceanic and Atmospheric Administration, National Integrated Drought Information System, accessed November 6, 2025. https://www.drought.gov/states/utah
- NWCC, n.d.: Snowpack: Snow Water Equivalent (SWE) and Snow Depth [Ben Lomond, UT]. Natural Resources Conservation Service, National Water and Climate Center, accessed November 6, 2025. https://www.nrcs.usda.gov/wps/portal/wcc/home/snowClimateMonitoring/snowpack/
- NWS, n.d.: Flooding in Utah. National Oceanic and Atmospheric Administration, National Weather Service, Silver Spring, MD, accessed November 6, 2025. https://www.weather.gov/safety/flood-states-ut
- USGCRP, 2017: Climate Science Special Report: Fourth National Climate Assessment, Volume I. Wuebbles, D.J., D.W. Fahey, K.A. Hibbard, D.J. Dokken, B.C. Stewart, and T.K. Maycock, Eds. U.S. Global Change Research Program, Washington, DC, USA, 470 pp. https://repository.library.noaa.gov/view/noaa/19486
- USGCRP, 2018: Impacts, Risks, and Adaptation in the United States: Fourth National Climate Assessment, Volume II. Reidmiller, D.R., C.W. Avery, D.R. Easterling, K.E. Kunkel, K.L.M. Lewis, T.K. Maycock, and B.C. Stewart, Eds. U.S. Global Change Research Program, Washington, DC, USA, 1515 pp. https://repository.library.noaa.gov/view/noaa/19487
- USGCRP, 2023: Fifth National Climate Assessment. Crimmins, A.R., C.W. Avery, D.R. Easterling, K.E. Kunkel, B.C. Stewart, and T.K. Maycock, Eds. U.S. Global Change Research Program, Washington, DC, USA. https://repository.library.noaa.gov/view/noaa/61592
- USGS, n.d.: Great Salt Lake Hydro Mapper. U.S. Geological Survey, Utah Water Science Center, accessed November 6, 2025. https://webapps.usgs.gov/gsl/
- USGS, n.d.: Water Data for the Nation. U.S. Geological Survey, accessed November 6, 2025. https://waterdata.usgs.gov/
- Utah Climate Center, n.d.: Great Salt Lake Annual Level Prediction. Utah State University, Utah Climate Center, Logan, UT, accessed November 6, 2025. https://climate.usu.edu/GSL.php
- Utah Department of Public Safety, 2024: Ch. 4. Hazard identification and risk assessment: 4.13 Wildfire Hazards. In: Utah Enhanced State Hazard Mitigation Plan. Utah Department of Public Safety, Division of Emergency Management, 275–307. https://hazards.utah.gov/wp-content/uploads/WildfireChapterHMP.pdf
- Utah Division of Water Resources, n.d.: Great Salt Lake. Utah Department of Natural Resources, Utah Division of Water Resources, accessed November 6, 2025. https://water.utah.gov/great-salt-lake/
- Wilkowske, C.D., T.A. Kenney, and T.S. McKinney, 2006: Flooding and Streamflow in Utah During Water Year 2005. Fact Sheet 2006-3085. U.S. Geological Survey, Utah Water Science Center, Salt Lake City, UT, 6 pp. https://doi.org/10.3133/fs20063085
- WRCC, n.d.: Climate of Utah. Western Regional Climate Center, Reno, NV, accessed November 6, 2025. https://wrcc.dri.edu/Climate/narrative_ut.php
- WRCC, n.d.: Utah's Top 10 Weather Events of the 1900s. Western Regional Climate Center, Reno, NV, accessed November 6, 2025. https://wrcc.dri.edu/Climate/extremes_ut.php